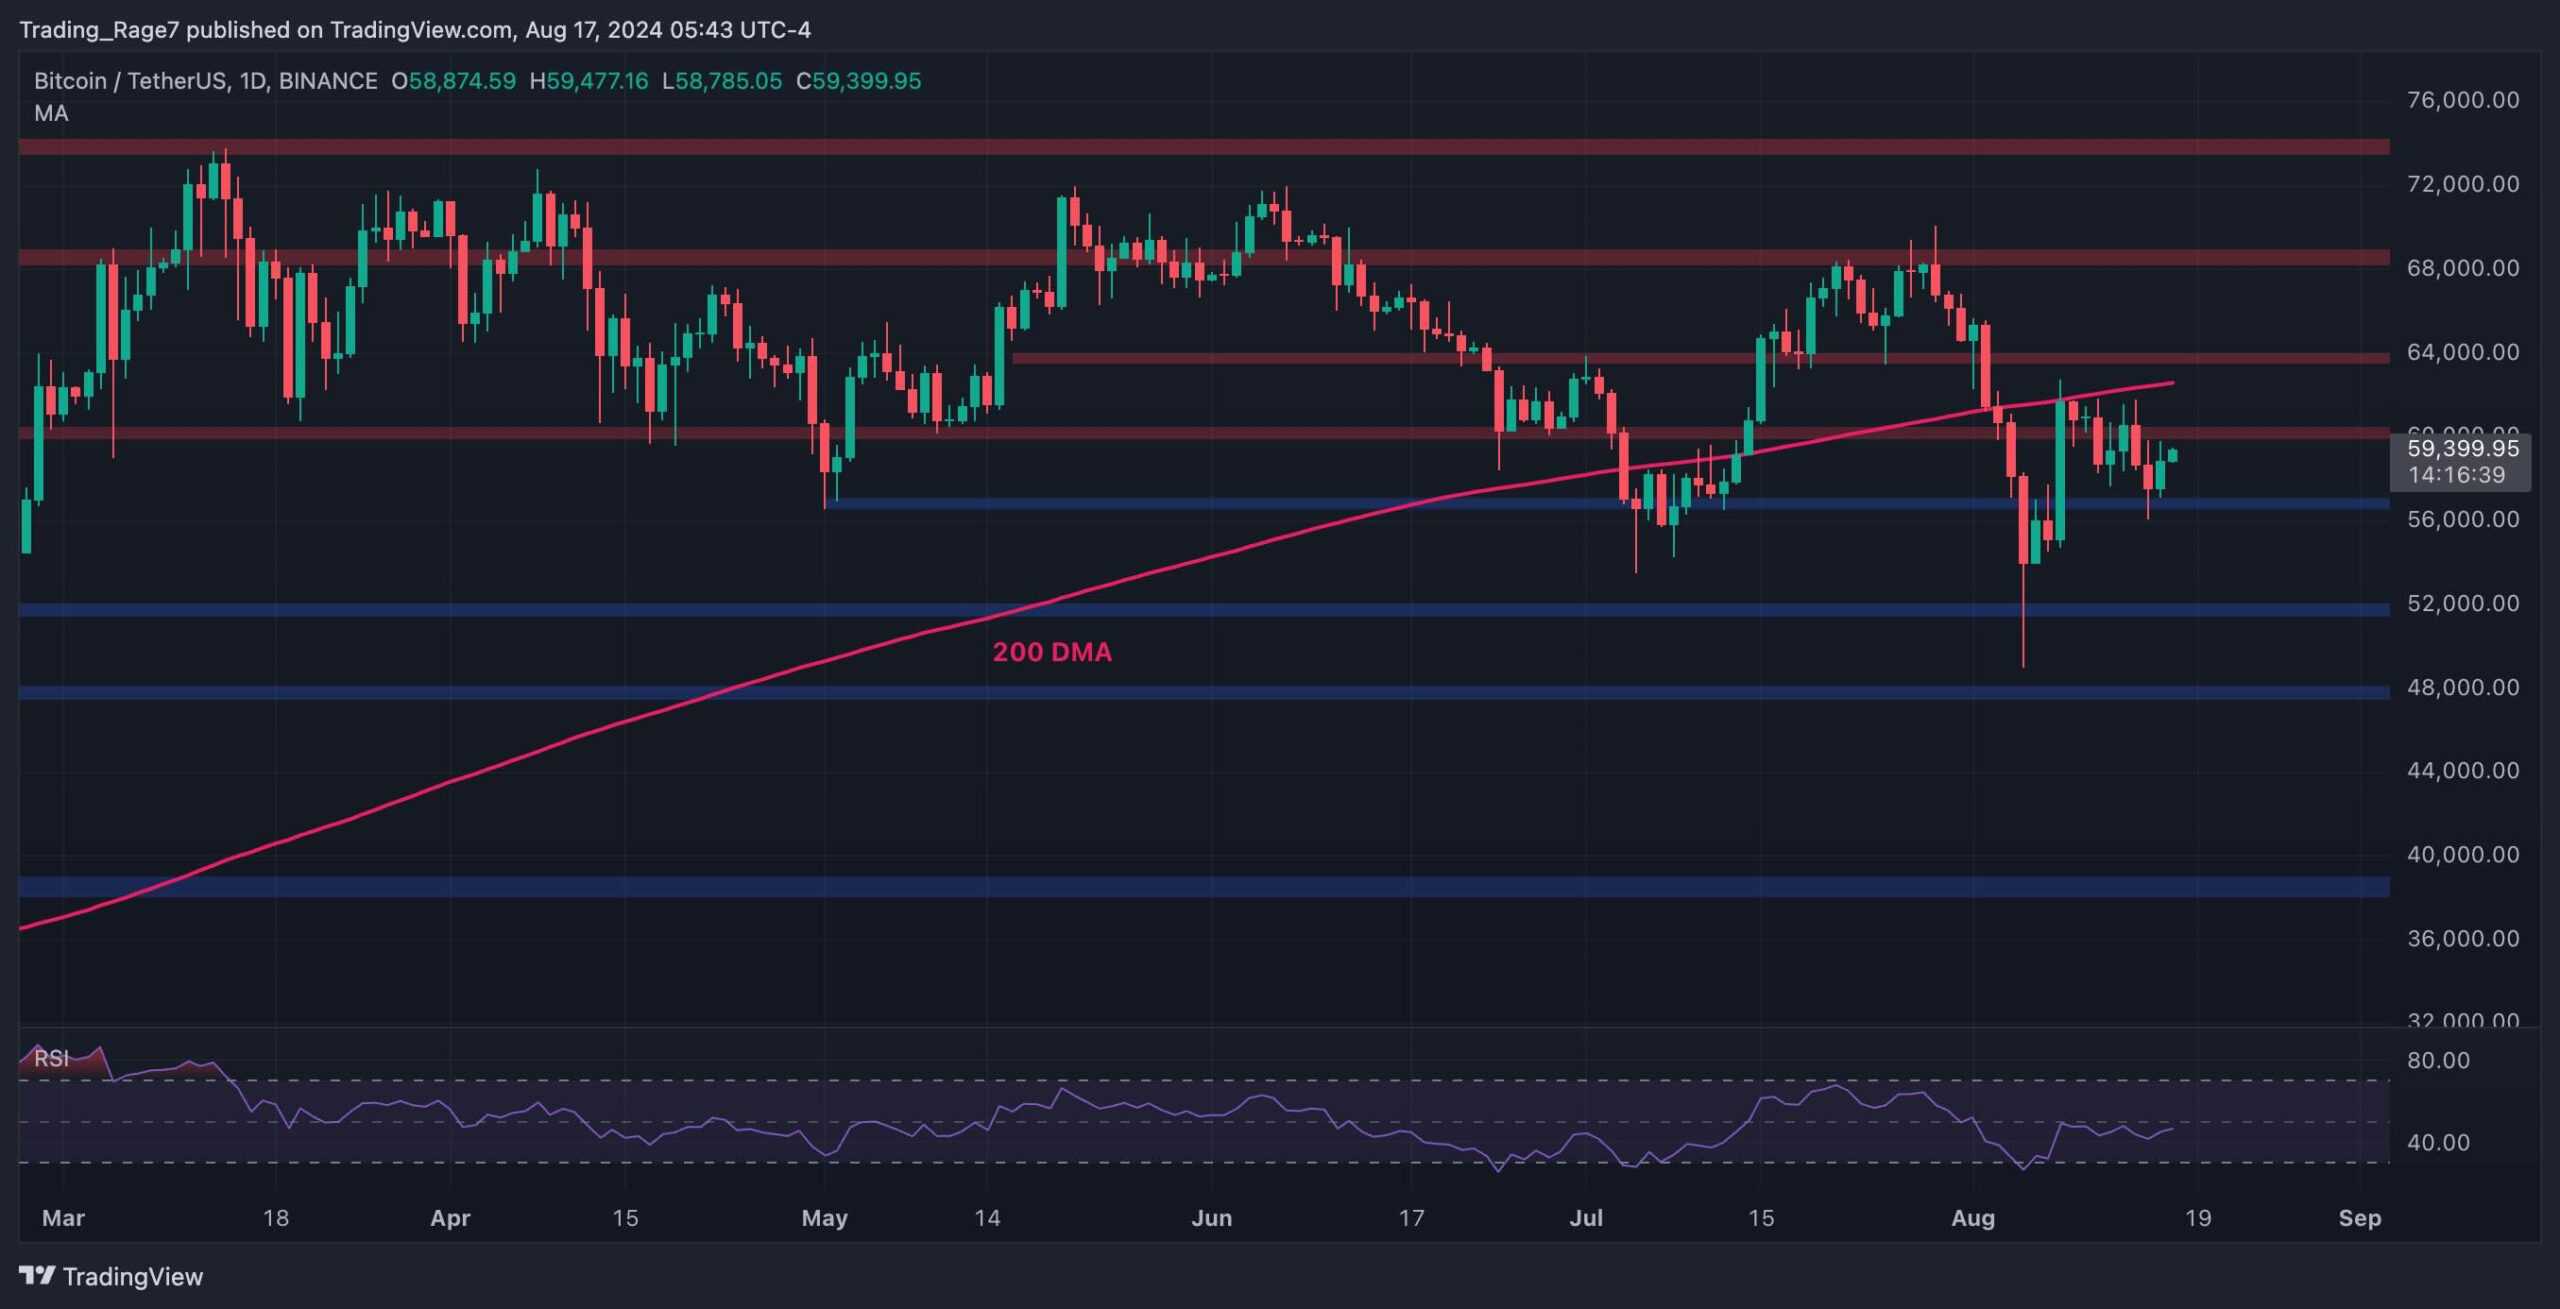
Bitcoin's (BTC) price is consolidating in a tight range as market participants are uncertain about the future direction of the price.

Bitcoin’s price has been consolidating in a tight range over the last few weeks as market participants remain uncertain about the future direction of the price following the significant drop below the 200-day moving average.
After dropping below the 200-day MA, BTC price took a hit and dropped toward the $50K area, where it found support and began to consolidate.
Currently, the market is consolidating below the moving average, which is located around the $63K mark, failing to climb back above.
Meanwhile, the $56K support level currently holds the market, preventing the price from dropping further. Therefore, a breakout from either this level or the 200-day moving average could determine the short-term price action of BTC and the crypto market.
Bitcoin’s 4-Hour Timeframe Analysis
Shifting our attention to the lower timeframe, specifically the 4-hour chart, we can observe a bullish flag pattern forming after the recent recovery from the $50K area.
The price has been consolidating within a narrowing range, with both the upper and lower trendlines converging. This type of price action usually indicates a period of indecision among traders before a breakout.
Considering the price action inside the flag pattern, it could only be a matter of time before the market breaks it to the upside, which could result in a rally toward the $64K resistance zone in the short term.
On the other hand, note that things could get ugly quickly if the flag gets broken to the downside.
Bitcoin On-Chain Analysis: Short-Term Holders SOPR
While Bitcoin’s price action has been quite choppy over the last few months, analyzing what the investors are going through can be insightful.
This chart presents the Bitcoin short-term holder SOPR, which measures the aggregate ratio of profits (or losses) realized by short-term investors. Values above one show aggregate profit realization, and values below one indicate losses being realized on aggregate.
As the chart suggests, during the last few months of consolidation, the profit margins for short-term holders have been declining, and they have even been realizing losses in the previous few weeks.
This could be a sign of impatience among short-term holders as they are selling at a loss to get out of the market quickly. While unfortunate, this shakeout could be a typical sign of a price bottom in the middle of a long-term bull run.
Yet, this is not guaranteed, as a wide range of factors can affect how the price will behave in the near future.
The above is the detailed content of Bitcoin (BTC) Price Consolidates, What to Expect?. For more information, please follow other related articles on the PHP Chinese website!


