
 Backend Development
Python Tutorial
Matplotlib Colormap Normalization: Visualizing Nonlinear Data
Backend Development
Python Tutorial
Matplotlib Colormap Normalization: Visualizing Nonlinear Data
Matplotlib Colormap Normalization: Visualizing Nonlinear Data

Introduction
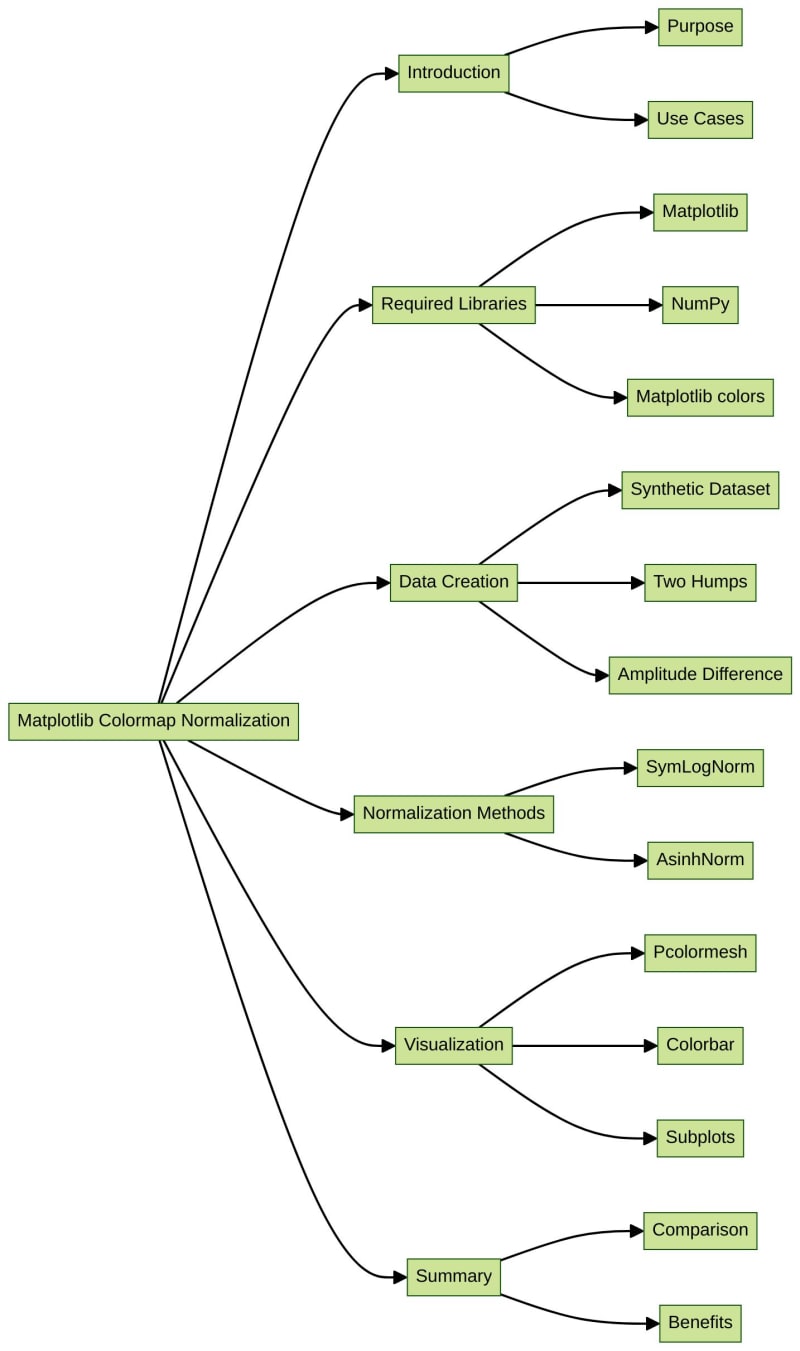
In data visualization, colormaps are used to represent numerical data through color. However, sometimes the data distribution may be nonlinear, which can make it difficult to discern the details of the data. In such cases, colormap normalization can be used to map colormaps onto data in nonlinear ways to help visualize the data more accurately. Matplotlib provides several normalization methods, including SymLogNorm and AsinhNorm, which can be used to normalize colormaps. This lab will demonstrate how to use SymLogNorm and AsinhNorm to map colormaps onto nonlinear data.
VM Tips
After the VM startup is done, click the top left corner to switch to the Notebook tab to access Jupyter Notebook for practice.
Sometimes, you may need to wait a few seconds for Jupyter Notebook to finish loading. The validation of operations cannot be automated because of limitations in Jupyter Notebook.
If you face issues during learning, feel free to ask Labby. Provide feedback after the session, and we will promptly resolve the problem for you.
Import Required Libraries
In this step, we will import the necessary libraries, including Matplotlib, NumPy, and Matplotlib colors.
import matplotlib.pyplot as plt
import numpy as np
import matplotlib.colors as colors
Create Synthetic Data
In this step, we will create a synthetic dataset consisting of two humps, one negative and one positive, with the positive hump having an amplitude eight times greater than the negative hump. We will then apply SymLogNorm to visualize the data.
def rbf(x, y):
    return 1.0 / (1 + 5 * ((x ** 2) + (y ** 2)))

N = 200
gain = 8
X, Y = np.mgrid[-3:3:complex(0, N), -2:2:complex(0, N)]
Z1 = rbf(X + 0.5, Y + 0.5)
Z2 = rbf(X - 0.5, Y - 0.5)
Z = gain * Z1 - Z2

shadeopts = {'cmap': 'PRGn', 'shading': 'gouraud'}
colormap = 'PRGn'
lnrwidth = 0.5
Apply SymLogNorm
In this step, we will apply SymLogNorm to the synthetic data and visualize the results.
fig, ax = plt.subplots(2, 1, sharex=True, sharey=True)

pcm = ax[0].pcolormesh(X, Y, Z,
                       norm=colors.SymLogNorm(linthresh=lnrwidth, linscale=1,
                                              vmin=-gain, vmax=gain, base=10),
                       **shadeopts)
fig.colorbar(pcm, ax=ax[0], extend='both')
ax[0].text(-2.5, 1.5, 'symlog')

pcm = ax[1].pcolormesh(X, Y, Z, vmin=-gain, vmax=gain,
                       **shadeopts)
fig.colorbar(pcm, ax=ax[1], extend='both')
ax[1].text(-2.5, 1.5, 'linear')

plt.show()
Apply AsinhNorm
In this step, we will apply AsinhNorm to the synthetic data and visualize the results.
fig, ax = plt.subplots(2, 1, sharex=True, sharey=True)

pcm = ax[0].pcolormesh(X, Y, Z,
                       norm=colors.SymLogNorm(linthresh=lnrwidth, linscale=1,
                                              vmin=-gain, vmax=gain, base=10),
                       **shadeopts)
fig.colorbar(pcm, ax=ax[0], extend='both')
ax[0].text(-2.5, 1.5, 'symlog')

pcm = ax[1].pcolormesh(X, Y, Z,
                       norm=colors.AsinhNorm(linear_width=lnrwidth,
                                             vmin=-gain, vmax=gain),
                       **shadeopts)
fig.colorbar(pcm, ax=ax[1], extend='both')
ax[1].text(-2.5, 1.5, 'asinh')

plt.show()
Summary
In this lab, we learned how to use SymLogNorm and AsinhNorm to map colormaps onto nonlinear data. By applying these normalization methods, we can visualize the data more accurately and discern the details of the data more easily.
? Practice Now: Matplotlib Colormap Normalization
Want to Learn More?
- ? Learn the latest Python Skill Trees
- ? Read More Python Tutorials
- ? Join our Discord or tweet us @WeAreLabEx
The above is the detailed content of Matplotlib Colormap Normalization: Visualizing Nonlinear Data. For more information, please follow other related articles on the PHP Chinese website!

Hot AI Tools

Undresser.AI Undress
AI-powered app for creating realistic nude photos

AI Clothes Remover
Online AI tool for removing clothes from photos.

Undress AI Tool
Undress images for free

Clothoff.io
AI clothes remover

AI Hentai Generator
Generate AI Hentai for free.

Hot Article
Hot Tools

Notepad++7.3.1
Easy-to-use and free code editor

SublimeText3 Chinese version
Chinese version, very easy to use

Zend Studio 13.0.1
Powerful PHP integrated development environment

Dreamweaver CS6
Visual web development tools

SublimeText3 Mac version
God-level code editing software (SublimeText3)
Hot Topics
 1384
1384
 52
52

 How to solve the permissions problem encountered when viewing Python version in Linux terminal?
Apr 01, 2025 pm 05:09 PM
How to solve the permissions problem encountered when viewing Python version in Linux terminal?
Apr 01, 2025 pm 05:09 PM
Solution to permission issues when viewing Python version in Linux terminal When you try to view Python version in Linux terminal, enter python...
 How to efficiently copy the entire column of one DataFrame into another DataFrame with different structures in Python?
Apr 01, 2025 pm 11:15 PM
How to efficiently copy the entire column of one DataFrame into another DataFrame with different structures in Python?
Apr 01, 2025 pm 11:15 PM
When using Python's pandas library, how to copy whole columns between two DataFrames with different structures is a common problem. Suppose we have two Dats...
 How to teach computer novice programming basics in project and problem-driven methods within 10 hours?
Apr 02, 2025 am 07:18 AM
How to teach computer novice programming basics in project and problem-driven methods within 10 hours?
Apr 02, 2025 am 07:18 AM
How to teach computer novice programming basics within 10 hours? If you only have 10 hours to teach computer novice some programming knowledge, what would you choose to teach...
 How to avoid being detected by the browser when using Fiddler Everywhere for man-in-the-middle reading?
Apr 02, 2025 am 07:15 AM
How to avoid being detected by the browser when using Fiddler Everywhere for man-in-the-middle reading?
Apr 02, 2025 am 07:15 AM
How to avoid being detected when using FiddlerEverywhere for man-in-the-middle readings When you use FiddlerEverywhere...
 What are regular expressions?
Mar 20, 2025 pm 06:25 PM
What are regular expressions?
Mar 20, 2025 pm 06:25 PM
Regular expressions are powerful tools for pattern matching and text manipulation in programming, enhancing efficiency in text processing across various applications.
 How does Uvicorn continuously listen for HTTP requests without serving_forever()?
Apr 01, 2025 pm 10:51 PM
How does Uvicorn continuously listen for HTTP requests without serving_forever()?
Apr 01, 2025 pm 10:51 PM
How does Uvicorn continuously listen for HTTP requests? Uvicorn is a lightweight web server based on ASGI. One of its core functions is to listen for HTTP requests and proceed...
 What are some popular Python libraries and their uses?
Mar 21, 2025 pm 06:46 PM
What are some popular Python libraries and their uses?
Mar 21, 2025 pm 06:46 PM
The article discusses popular Python libraries like NumPy, Pandas, Matplotlib, Scikit-learn, TensorFlow, Django, Flask, and Requests, detailing their uses in scientific computing, data analysis, visualization, machine learning, web development, and H
 How to dynamically create an object through a string and call its methods in Python?
Apr 01, 2025 pm 11:18 PM
How to dynamically create an object through a string and call its methods in Python?
Apr 01, 2025 pm 11:18 PM
In Python, how to dynamically create an object through a string and call its methods? This is a common programming requirement, especially if it needs to be configured or run...
