

New v3.13 release came out today! This release comes with 4 new features, 2 bug fixes and tooling improvements.
For the detailed release info, please checkout the release note:
https://github.com/naver/billboard.js/releases/tag/3.13.0
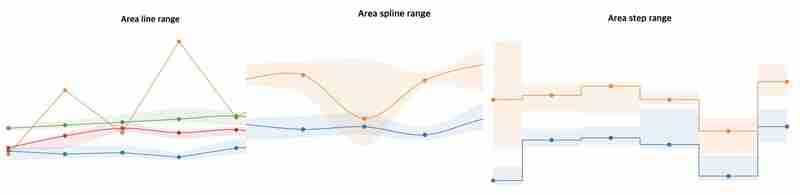
Range types are useful visualize “ranged values” from the baseline value. From this release will provide new “step” type to the variation.
Demo: https://naver.github.io/billboard.js/demo/#Chart.FunnelChart
import bb, {areaStepRange} from "billboard";

bb.generate({
  data: {
    columns: [
     ["data1", [70, 40, 30],
     [155, 130, 115],
     [160, 135, 120],
     [200, 120, 110],
     [95, 50, 40],
     [199, 160, 125]
    ]],
    type: areaStepRange()
  }
});
To render some range with dashed line, data.regions option is used. But the way of rendering dashed lines, done by combining multiple path command as dashed lines needed to be.
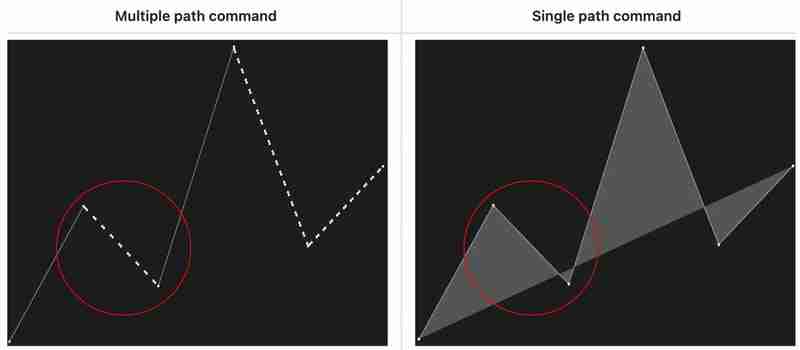
From the above example screenshot, multiple path command are needed to draw dashed lines.
## Multiple path command
M5,232L95,136M99,139L104,142 M109,145L114,149 ... M L M L ...

## Single path command
M4,232,136L139,192L206,23L274,164L341,108
This approach caused some rendering issues(#1, #2) and we tried to improve this on native way.
Instead of drawing dashed lines with path commands, we moved to render using stroke-dasharray style property.
Demo: https://naver.github.io/billboard.js/demo/#Chart.LineChartWithRegions
On zoom interaction, animation frame performance has been improved from 84ms → 5ms!
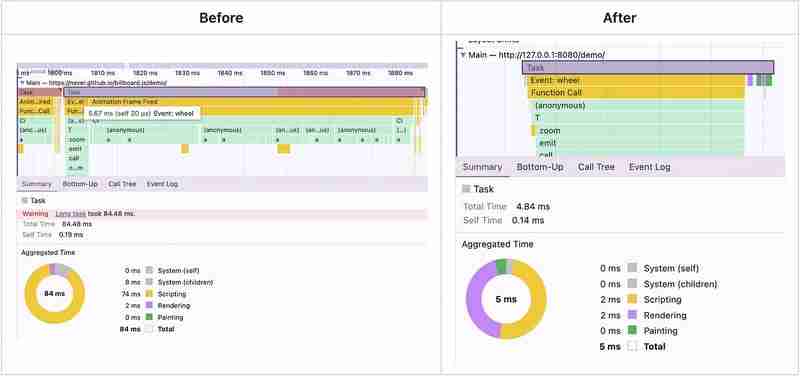
By updating to 3.12, will get the benefit without any code changes.
legend.format: provide original data id
When data.names option is specified, it will make display data names different than the original names(id).
{
  data: {
    names: {
      // will make data1 and data2, displayed in different values.
      data1: "Detailed Name",
      data2: "Name Detailed"
    },
    columns: [
       ["data1", 71.4],
       ["data2", 10]
    ]
  }
}
In this case, legend.format callback, will receive data.names replaced value, instead the original id.
data: {
    names: {
      // will make data1 and data2, displayed in different values.
      data1: "Detailed Name",
      data2: "Name Detailed"
    },
}
legend: {
    format: function(id) {
       // id will be 'Detailed Name' and 'Name Detailed'
    }
}
From this release will provide original ‘id’ value with the replaced names.
data: {
    names: {
      // will make data1 and data2, displayed in different values.
      data1: "Detailed Name",
      data2: "Name Detailed"
    },
}
legend: {
    format: function(id, dataId) {
        // id will be 'Detailed Name' and 'Name Detailed'
        // dataId will be 'data1' and 'data2'
    }
}
Demo: https://naver.github.io/billboard.js/demo/#Legend.LegendFormat
Previously, bar.width was possible specify absolute value or in ratio value. absolute can’t reflect chart resize dynamically and ratio can reflect with some limitation.
The way ratio is calculated is based on below equation.
x Axis tick Interval * ratio
For example, if chart has width of 500px, with 5 x Axis tick count, the interval will be 100px roughly.
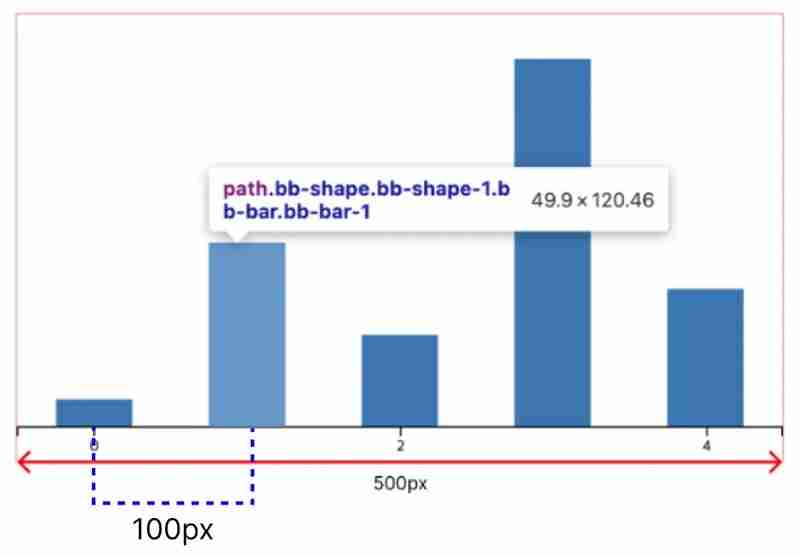
In this case, if bar.ratio=0.5 is specified, the equation will be as follows, and bar’s width will be 49.9px.
100(exact value is 99.8) * 0.5 = 49.9
To give more control adjusting bar’s width value, will enhance bar.width option to accept a callback function with handy parameters.
Demo: https://naver.github.io/billboard.js/demo/#BarChartOptions.BarWidth
bar: {
    width: function(width, targetsNum, maxDataCount) {
         // - width: chart area width
         // - targetsNum: number of targets
         // - maxDataCount: maximum data count among targets
   }
}
We adopted Karma + Mocha for our test framework and it was great experience to maintain billboard.js to be stable.
Sadly, Karma announced the deprecation and we needed to migrate some other modern test frameworks to keep the library stable and following the modern ecosystem.
After some research, we decided to move to vitest. We successfully migrated within this release and local testing has been improved up to 63%!
| Packages | Duration | Diff over Karma |
|---|---|---|
| Karma (Mocha + Chai) | 142.382 | - |
| Vitest (webdriverio:chrome) | 144.364* | +1.39% |
| Vitest (playwright:chromium) | 51.606** | -63.75% |
Form more details, checkout https://github.com/naver/billboard.js/pull/3866
That’s all we have for this release and thanks to stay tuned!
The above is the detailed content of billboard.js elease: new area-step-range chart!. For more information, please follow other related articles on the PHP Chinese website!


![[Web front-end] Node.js quick start](https://img.php.cn/upload/course/000/000/067/662b5d34ba7c0227.png)


