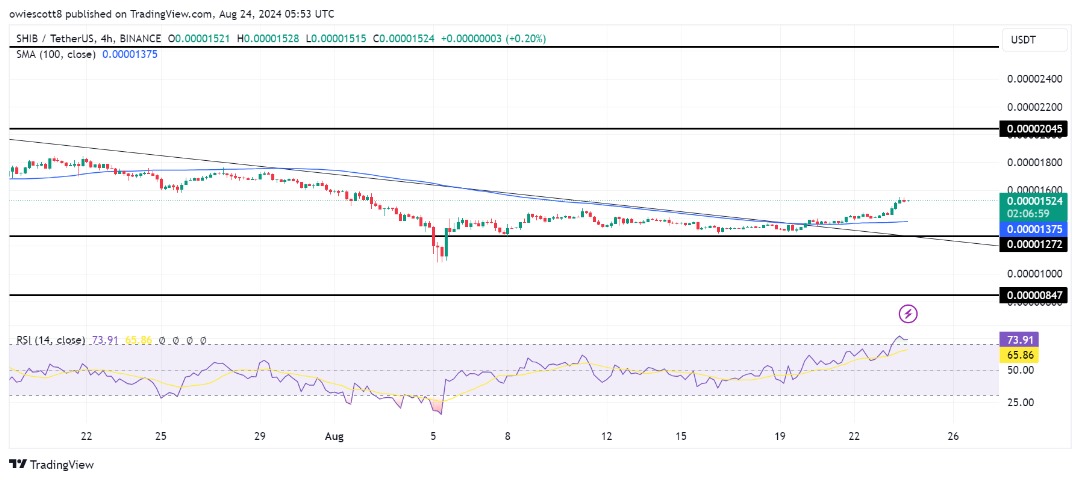
Shiba Inu (SHIB) has recently surged past a key bullish trendline, sparking fresh optimism among traders and investors. This breakout marks a significant
 .00002045?" >
Shiba Inu (SHIB) recently breached a crucial bullish trendline, sparking fresh optimism among traders and investors. This breakout could herald a potential rally toward the $0.00002045 level, shifting the attention to whether SHIB can sustain its upward trajectory or face resistance from the bears.
This article provides an in-depth technical analysis of Shiba Inu’s recent breakout above the trendline, assessing its potential to trigger a rally toward the $0.00002045 target. Additionally, it will explore possible price reactions as SHIB approaches this critical level.
In the last 24 hours, Shiba Inu has seen a moderate increase of around 6%, reaching an approximate price of $0.00001519. The crypto asset’s market capitalization is now over $8.9 billion, with trading volume exceeding $311 million. During this period, the market cap increased by 6.59%, while trading volume surged by 85.23%.
Trendline Breakout: A Bullish Signal For Shiba Inu?
Following the breakout above the trendline, SHIB's price has maintained its bullish momentum, consistently trading above the 100-day Simple Moving Average (SMA) on the 4-hour chart. This sustained positive sentiment reflects strong upward momentum, signaling that the bulls are firmly in control and could push the price toward the next significant resistance level at $0.00002045.
Also, the Relative Strength Index (RSI) indicator is currently at 73%, showing that Shiba Inu is in an overbought territory. A sustained overbought condition signals strong buying pressure suggesting that bullish momentum remains robust in the market.
On the daily chart, although SHIB is experiencing a short-term pullback, it is attempting to move toward the 100-day SMA following a successful breakout above the bearish trendline. The appearance of a bullish momentum candlestick on the previous day indicates a strong bullish sentiment, which could drive the cryptocurrency toward further gains.
Finally, the 1-day RSI indicates that SHIB’s bullish momentum is strengthening, with the signal line moving toward the overbought region after recently crossing above 50%. The upward movement in the RSI suggests intensifying buying pressure and growing bullish sentiment for the asset.
Potential Market Reactions: What Happens If SHIB Hits $0.00002045?
Potential price reactions when Shiba Inu reaches $0.00002045 include a breakout above this level or a potential rebound.
If Shiba Inu breaks above the $0.00002045 level, it could signal the beginning of a sustained bullish rally toward the $0.00002631 resistance level. A successful break above this level could propel the asset toward the next resistance at $0.00002960, with the potential for even higher gains.
However, if the cryptocurrency encounters a rebound at the $0.00002045 resistance level, the price may retrace to its previous low of $0.00001272. When SHIB breaks below this support, it could indicate an additional downside momentum, potentially driving the asset toward the $0.00000847 mark and possibly lower levels.
The above is the detailed content of Shiba Inu Breaks Above Trendline: Can The Bulls Drive SHIB To $0.00002045?. For more information, please follow other related articles on the PHP Chinese website!
 What are the SEO keyword ranking tools?
 The use of declare in Oracle
 close port
 Self-study for beginners in C language with zero foundation
 How to get the current time in JAVA
 The difference and connection between c language and c++
 How to solve the problem that css cannot be loaded
 How to use redis as a cache server


