How to convert data into chart showing percentage in excel

王林
Release: 2024-08-26 12:36:05
Original
735 people have browsed it

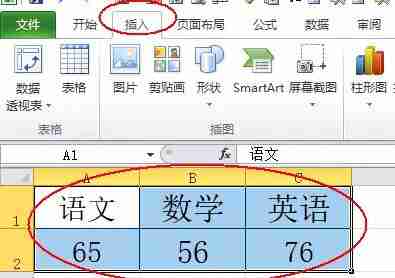
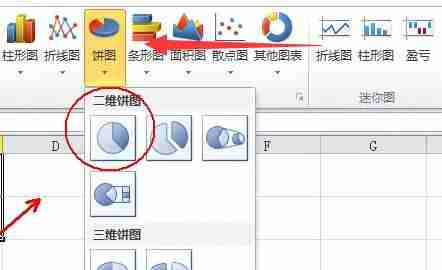
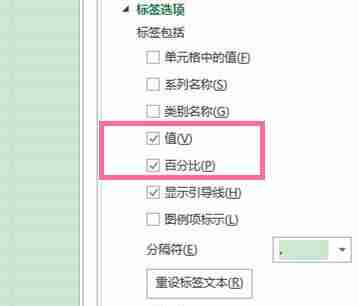
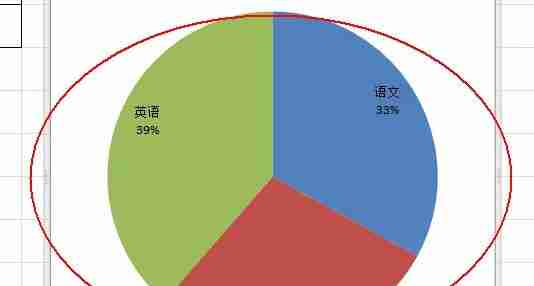
How to convert data into a chart to display percentages in excel? Many of us record various data through tables, but when it comes to comparison, it is more obvious in the form of percentages. Therefore, many users want to convert it into a pie chart to display percentages, but they don't know how to do it. , it doesn’t matter, today the editor of PHP Chinese website will share with you the specific operation methods. I hope that the content of this software tutorial can be helpful to everyone. Method for converting excel data into a chart displaying percentages: 1. First, we select the data to be converted and enter Insert

excel怎么将数据转换成图表显示百分比

2. Then click on the pie chart and select a desired pie chart format.

excel怎么将数据转换成图表显示百分比

3. After creating the pie chart, select it, click the + on the right and then click the small arrow.

excel怎么将数据转换成图表显示百分比

4. Then open more options

excel怎么将数据转换成图表显示百分比

5. Finally, check the value and percentage on the right

excel怎么将数据转换成图表显示百分比

6. This will allow the percentage to be displayed in the chart.

excel怎么将数据转换成图表显示百分比

The above is the detailed content of How to convert data into chart showing percentage in excel. For more information, please follow other related articles on the PHP Chinese website!

source:xpwin7.com
Statement of this Website
The content of this article is voluntarily contributed by netizens, and the copyright belongs to the original author. This site does not assume corresponding legal responsibility. If you find any content suspected of plagiarism or infringement, please contact admin@php.cn
Popular Tutorials
More>
Latest Downloads
More>
Web Effects
Website Source Code
Website Materials
Front End Template
About us Disclaimer Sitemap
php.cn:Public welfare online PHP training,Help PHP learners grow quickly!