
 Software Tutorial
Computer Software
How to customize the x-axis and y-axis in excel The most comprehensive way to set the x-axis and y-axis in excel
Software Tutorial
Computer Software
How to customize the x-axis and y-axis in excel The most comprehensive way to set the x-axis and y-axis in excel
How to customize the x-axis and y-axis in excel The most comprehensive way to set the x-axis and y-axis in excel

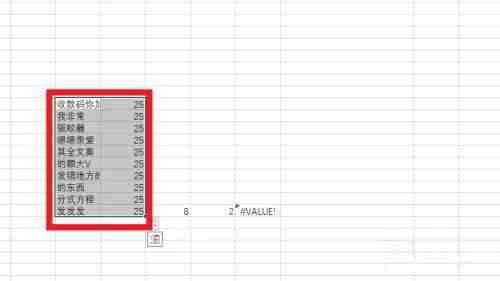
When inserting a chart in Excel, you need to set the x-axis and y-axis, such as name, interchange, value, position, etc. However, there are still many novice users who don’t know how to set the x-axis and y-axis in excel charts. The editor below will bring you a detailed operation process. Come and try it. 1. In the excel interface, select the data.

The above is the detailed content of How to customize the x-axis and y-axis in excel The most comprehensive way to set the x-axis and y-axis in excel. For more information, please follow other related articles on the PHP Chinese website!

Hot AI Tools

Undresser.AI Undress
AI-powered app for creating realistic nude photos

AI Clothes Remover
Online AI tool for removing clothes from photos.

Undress AI Tool
Undress images for free

Clothoff.io
AI clothes remover

Video Face Swap
Swap faces in any video effortlessly with our completely free AI face swap tool!

Hot Article
Hot Tools

Notepad++7.3.1
Easy-to-use and free code editor

SublimeText3 Chinese version
Chinese version, very easy to use

Zend Studio 13.0.1
Powerful PHP integrated development environment

Dreamweaver CS6
Visual web development tools

SublimeText3 Mac version
God-level code editing software (SublimeText3)
Hot Topics


 How much does Microsoft PowerToys cost?
Apr 09, 2025 am 12:03 AM
How much does Microsoft PowerToys cost?
Apr 09, 2025 am 12:03 AM
Microsoft PowerToys is free. This collection of tools developed by Microsoft is designed to enhance Windows system functions and improve user productivity. By installing and using features such as FancyZones, users can customize window layouts and optimize workflows.
 What is the best alternative to PowerToys?
Apr 08, 2025 am 12:17 AM
What is the best alternative to PowerToys?
Apr 08, 2025 am 12:17 AM
ThebestalternativestoPowerToysforWindowsusersareAutoHotkey,WindowGrid,andWinaeroTweaker.1)AutoHotkeyoffersextensivescriptingforautomation.2)WindowGridprovidesintuitivegrid-basedwindowmanagement.3)WinaeroTweakerallowsdeepcustomizationofWindowssettings
 Does PowerToys need to be running?
Apr 02, 2025 pm 04:41 PM
Does PowerToys need to be running?
Apr 02, 2025 pm 04:41 PM
PowerToys needs to be run in the background to achieve its full functionality. 1) It relies on system-level hooks and event listening, such as FancyZones monitoring window movement. 2) Reasonable resource usage, usually 50-100MB of memory, and almost zero CPU usage when idle. 3) You can set up power-on and use PowerShell scripts to implement it. 4) When encountering problems, check the log files, disable specific tools, and ensure that they are updated to the latest version. 5) Optimization suggestions include disabling infrequently used tools, adjusting settings, and monitoring resource usage.
 What is the purpose of PowerToys?
Apr 03, 2025 am 12:10 AM
What is the purpose of PowerToys?
Apr 03, 2025 am 12:10 AM
PowerToys is a free collection of tools launched by Microsoft to enhance productivity and system control for Windows users. It provides features through standalone modules such as FancyZones management window layout and PowerRename batch renaming files, making user workflow smoother.
 Does Microsoft PowerToys require a license?
Apr 07, 2025 am 12:04 AM
Does Microsoft PowerToys require a license?
Apr 07, 2025 am 12:04 AM
Microsoft PowerToys does not require a license and is a free open source software. 1.PowerToys provides a variety of tools, such as FancyZones for window management, PowerRename for batch renaming, and ColorPicker for color selection. 2. Users can enable or disable these tools according to their needs to improve work efficiency.
 How do I download Microsoft PowerToys?
Apr 04, 2025 am 12:03 AM
How do I download Microsoft PowerToys?
Apr 04, 2025 am 12:03 AM
The way to download Microsoft PowerToys is: 1. Open PowerShell and run wingetinstallMicrosoft.PowerToys, 2. or visit the GitHub page to download the installation package. PowerToys is a set of tools to improve Windows user productivity. It includes features such as FancyZones and PowerRename, which can be installed through winget or graphical interface.
 Is PowerToys part of Windows 11?
Apr 05, 2025 am 12:03 AM
Is PowerToys part of Windows 11?
Apr 05, 2025 am 12:03 AM
PowerToys is not the default component of Windows 11, but a set of tools developed by Microsoft that needs to be downloaded separately. 1) It provides features such as FancyZones and Awake to improve user productivity. 2) Pay attention to possible software conflicts and performance impacts when using them. 3) It is recommended to selectively enable the tool and periodically update it to optimize performance.
 Is Microsoft PowerToys free or paid?
Apr 06, 2025 am 12:14 AM
Is Microsoft PowerToys free or paid?
Apr 06, 2025 am 12:14 AM
Microsoft PowerToys is completely free. This tool set provides open source utilities that enhance Windows operating system, including features such as FancyZones, PowerRename, and KeyboardManager, to help users improve productivity and customize their operating experience.
