Hi,
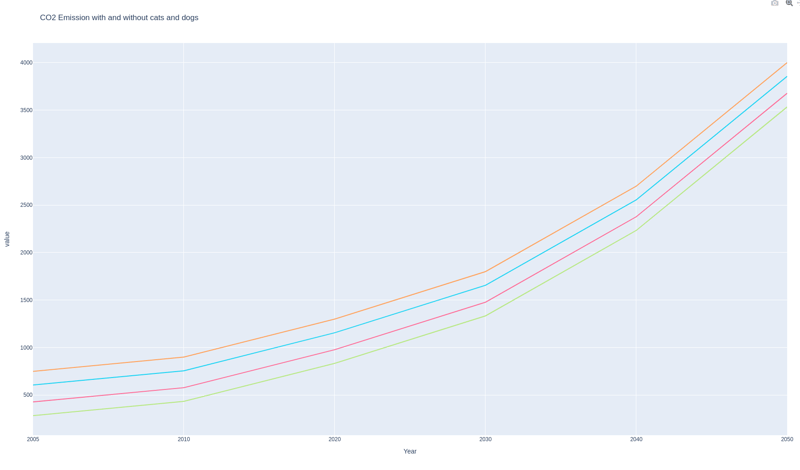
I've found a small article that talks about pet emissions, so I've decided to display the CO2 emissions if they don't exist.
Code :
https://github.com/victordalet/Kaggle_analysis/tree/feat/dog_co2
Sources:
https://www.lekaba.fr/article/l-empreinte-carbone-des-chiens-et-des-chats-un-amour-qui-pese-lourd-sur-le-climat
https://www.umweltbundesamt.de/en/image/global-f-gas-emissions-up-to-2050-total
https://www.rover.com/fr/blog/combien-y-a-t-il-de-chats-dans-le-monde/
First, I obtain data estimating the world's CO2 consumption, the average emission of a dog and a cat, and the number of these pets.
import plotly.express as px


class Main:
    def __init__(self):
        self.estimation = {
            "2005": 750,
            "2010": 900,
            "2020": 1300,
            "2030": 1800,
            "2040": 2700,
            "2050": 4000,
        }

        self.estimation_no_cat = {
            "2005": 750,
            "2010": 900,
            "2020": 1300,
            "2030": 1800,
            "2040": 2700,
            "2050": 4000,
        }

        self.estimation_no_dog = {
            "2005": 750,
            "2010": 900,
            "2020": 1300,
            "2030": 1800,
            "2040": 2700,
            "2050": 4000,
        }

        self.estimation_no_cat_and_dog = {
            "2005": 750,
            "2010": 900,
            "2020": 1300,
            "2030": 1800,
            "2040": 2700,
            "2050": 4000,
        }

        self.cat_emission = 240
        self.dog_emission = 358
        self.nb_cats = 600000000
        self.nb_dogs = 900000000
The total emission is in millions of tons, so I've created a method for converting the animal data, which are in kg.
    @staticmethod
    def transform_to_million_of_tonnes(value):
        return value / (1000000 * 1000)
To modify the estimate without cat or dog, go through the first estimate and replace the values of the other dictionaries with the values found in the first step.
    def calculate(self):
        for year, value in self.estimation.items():
            self.estimation_no_cat[year] = value - self.transform_to_million_of_tonnes(
                self.cat_emission * self.nb_cats
            )
            self.estimation_no_dog[year] = value - self.transform_to_million_of_tonnes(
                self.dog_emission * self.nb_dogs
            )
            self.estimation_no_cat_and_dog[year] = (
                value
                - self.transform_to_million_of_tonnes(self.cat_emission * self.nb_cats)
                - self.transform_to_million_of_tonnes(self.dog_emission * self.nb_dogs)
            )
To display a graph with all the data, I use the plotly library.
Code for pip installation :
pip install plotly
Code to display the three estimates :
    def display(self):
        fig = px.line(
            x=list(self.estimation.keys()),
            y=[
                list(self.estimation.values()),
                list(self.estimation_no_cat.values()),
                list(self.estimation_no_dog.values()),
                list(self.estimation_no_cat_and_dog.values()),
            ],
            labels={
                "x": "Year",
                "y": "CO2 Emission (in million of tonnes)",
                "color": "Legend",
            },
            title="CO2 Emission with and without cats and dogs",
            color_discrete_map={
                "CO2 Emission": "blue",
                "CO2 Emission without cats": "green",
                "CO2 Emission without dogs": "red",
                "CO2 Emission without cats and dogs": "orange",
            },
        )
        fig.show()
So now we have the chart with our results.

The above is the detailed content of Emmision COf a cat and a dog with python. For more information, please follow other related articles on the PHP Chinese website!


