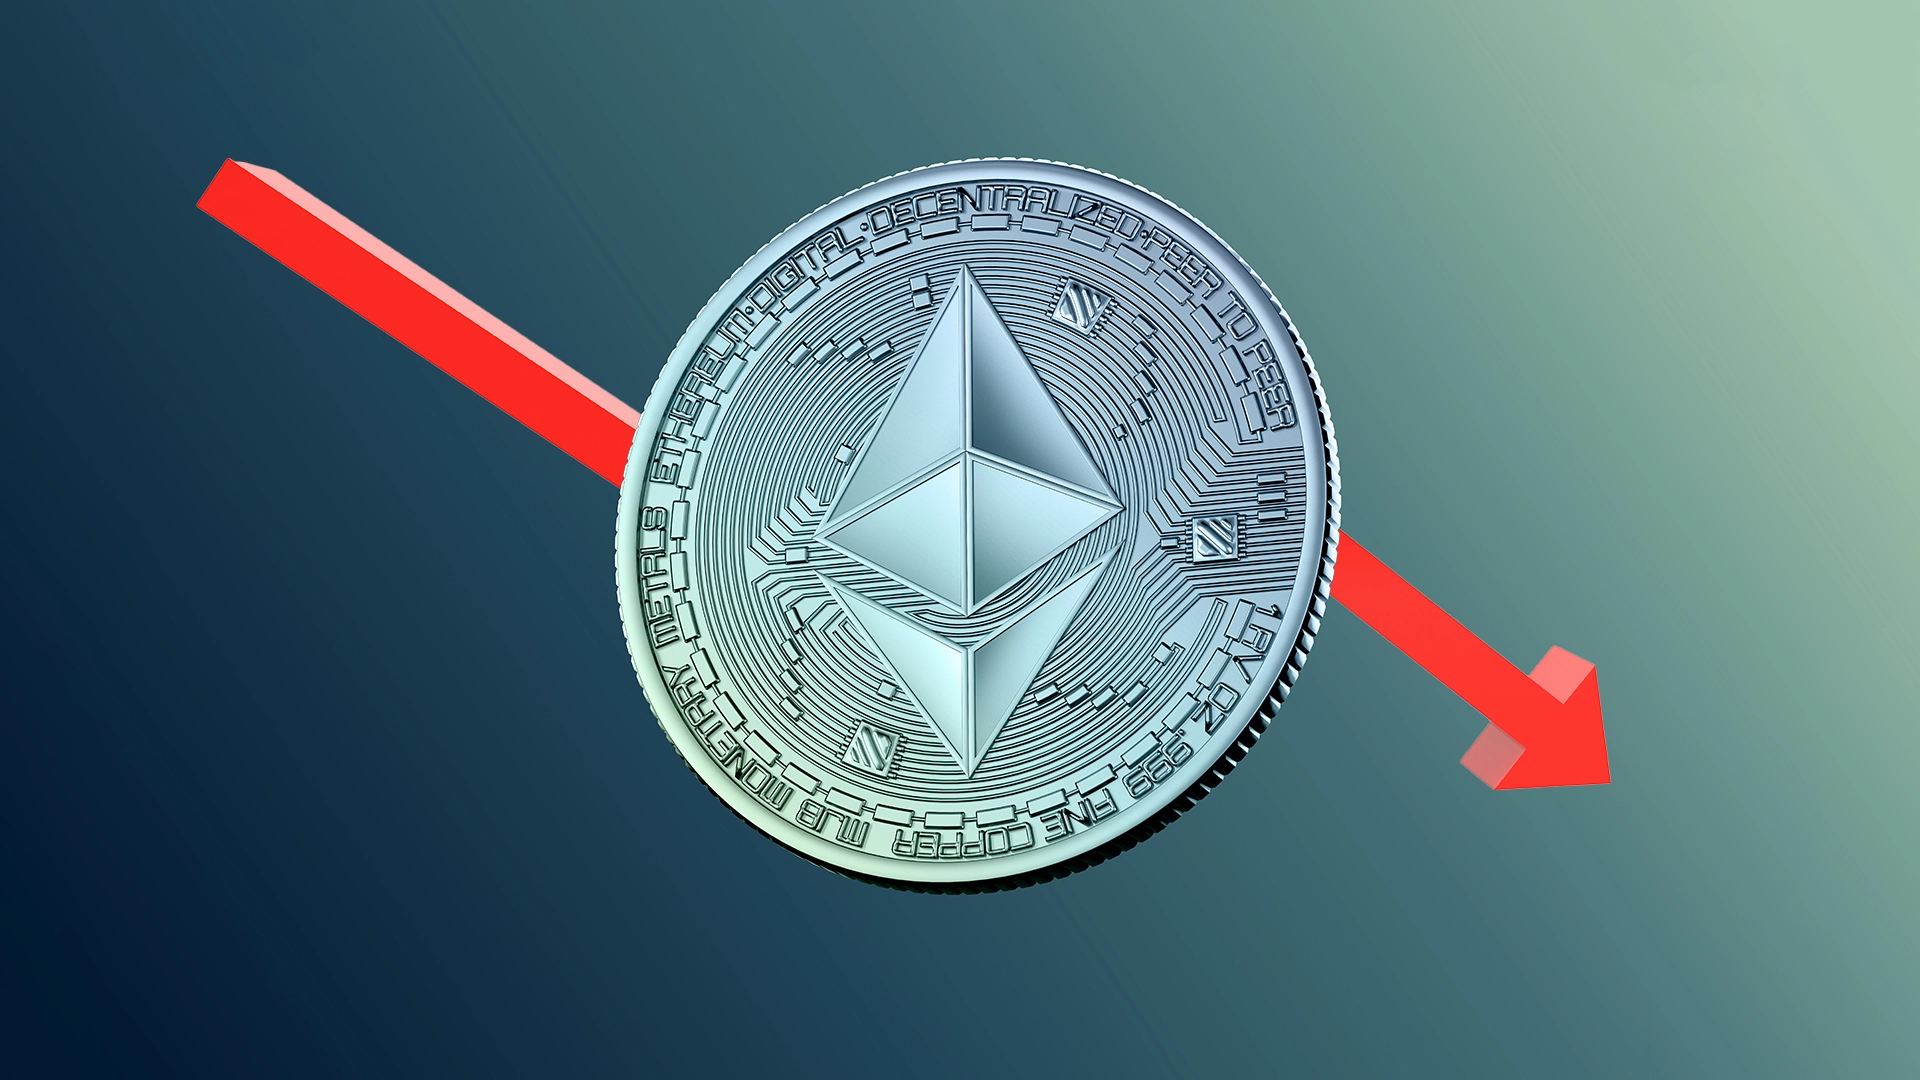
Ethereum (ETH) is the second-largest cryptocurrency in the global crypto market at the time of writing. It has a market cap of $303.169 Billion

Ethereum (CRYPTO: ETH), the second-largest cryptocurrency in the world, had 345.85 million holders at press time, and the number of addresses holding the token has been steadily increasing. This indicates a rise in holder confidence, as 74% of total holders have held it for more than 1 year.
Over the last 24 hours, ETH's market cap increased by 2.1%. The coin had a volume of $14.257 billion in trades, which equates to a volume/market cap ratio of 4.69%.
Derivatives in Support of Sellers: Who Will Lead the Price?
The Ethereum coin's derivatives trading volume increased by 120% over the last 24 hours to $25.06 billion. The token's options volume also increased by 250%, indicating strong trader engagement in the coin.
The coin also saw higher long liquidations ($31.79 million) and short liquidations ($11.73 million) over the last 24 hours, respectively, indicating seller dominance.
Moreover, the token's open positions increased by 1.9%, bringing the open interest value to $10.67 billion.
Will ETH Price Reach Higher Levels From the Support?
The price of Ethereum has been trading in a strong downtrend for the past few days. This occurred as the price fell by 30% from its most recent swing high and hit the falling wedge's upper band.
At press time, ETH hit the lower band of the falling wedge pattern and a strong bullish candle was formed at lower levels, indicating buyers' entry into the coin.
If the ETH price gains momentum, breaks the falling wedge pattern, and sustains itself above the same, the trend may turn bullish and a most recent swing high of $2800 can be seen.
If the price breaks above the same, a rally to the upper band may also be seen, which could present a good opportunity to buy the coin for short-term price momentum.
What do the Technical Indicators Show About ETH Coin?
The 50-day and 200-day EMAs have crossed in a death cross and the price was trading below the following EMAs.
ETH/USD Chart by TradingView
The MACD and the signal line were trading in the negative trajectory while the following metrics overlapped. The RSI also took resistance at the 50 level and was trading below the 14-day SMA.
The ETH price might take support at $1535 and $2110. It was followed by the resistance levels of $3560 and $3970.
This article is for informational purposes only and does not provide any financial, investment, or other advice. The author or any people mentioned in this article are not responsible for any financial loss that may occur from investing in or trading. Please do your research before making any financial decisions.
The above is the detailed content of Ethereum (ETH) Price Prediction 2023-24: Will ETH Price Reach Higher Levels From the Support?. For more information, please follow other related articles on the PHP Chinese website!


