

Data Structures and Algorithms: Graphs

Introduction
A graph is a data structure with a number of vertices(nodes) and edges(connections) between them.
A tree is an example of a graph. Every tree is a graph but not every graph is a tree, for example, graphs that have cycles are not trees. A tree will have one root and one unique path between two nodes whilst a graph can have many roots and multiple paths between vertices.
Basic Terminology
Vertex: A node in a graph.
Edge: The connection between two vertices.
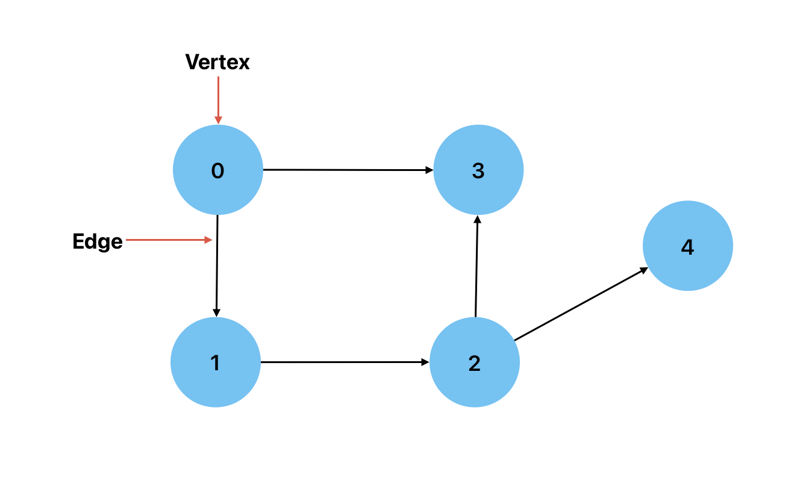
Directed: When the connection between two vertices has a direction. This implies that there is only one way to get from one vertex to another. An example could be graph showing the cities(vertices) and the routes(edges) between them.
Undirected: When the connection between two vertices on a graph goes both ways. An example could be a graph showing people(vertices) connected by their friendships.
Degree: The number of edges connected to a vertex. The vertices of a directed graph can have an indegree or an outdegree, which is the number of edges pointing towards and away from the vertex respectively.
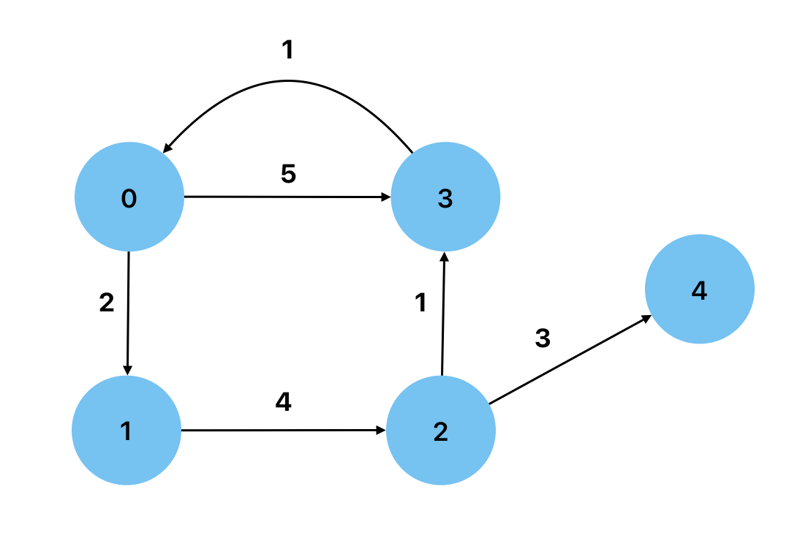
Weighted: A graph in which the edges have values as weights. An example could be a road map, where the distances between nodes are represented as weights.
Cyclic: A graph that has a path from at least one vertex back to itself.
Acyclic: A graph that has no cycles, that is to say, no node has a path back to itself. A Directed Acyclic Graph is a type of graph that can be used to show data processing flows.
Dense: When a graph has close to the maximum possible number of edges
Sparse: When a graph has close to the minimum possible number of edges.
Self-loop: When an edge has one vertex linking to itself.
Multi-edge: When a graph has multiple edges between two vertices.
Simple: When a graph has no self-loops nor multi-edges.
To get the maximum number of edges in a simple directed graph: n*(n-1) where n is the number of nodes.
To get the maximum number of edges in a simple undirected graph: n*(n-1)/2 where n is the number of nodes.
Implementing graphs in JavaScript
To implement a graph, we can start by specifying the vertices and edges of a graph, below is an example of how to do this given the following graph:
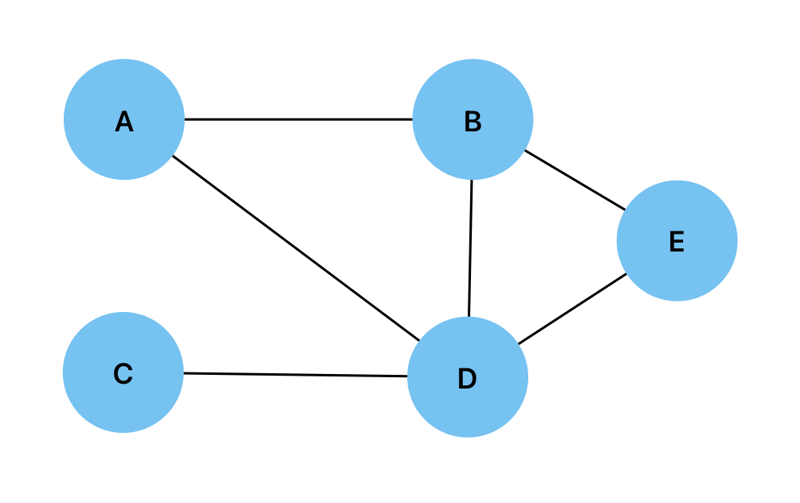
const vertices = ["A", "B", "C", "D", "E"];

const edges = [
  ["A", "B"],
  ["A", "D"],
  ["B", "D"],
  ["B", "E"],
  ["C", "D"],
  ["D", "E"],
];
Then we can create a function to find what is adjacent to a given vertex:
const findAdjacentNodes = function (node) {
  const adjacentNodes = [];
  for (let edge of edges) {
    const nodeIndex = edge.indexOf(node);
    if (nodeIndex > -1) {
      let adjacentNode = nodeIndex === 0 ? edge[1] : edge[0];
      adjacentNodes.push(adjacentNode);
    }
  }
  return adjacentNodes;
};
And another function to check if two vertices are connected:
const isConnected = function (node1, node2) {
  const adjacentNodes = new Set(findAdjacentNodes(node1));
  return adjacentNodes.has(node2);
};
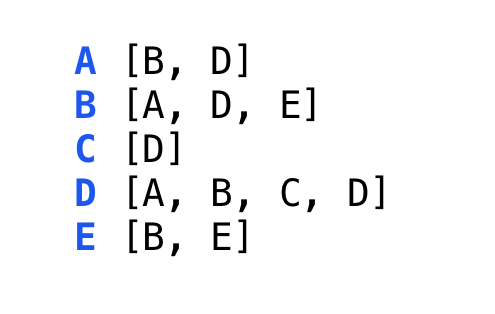
Adjacency List
An adjacency list is a representation of a graph where all of the vertices that are connected to a node are stored as a list. Below is a graph and a visual representation of its corresponding adjacency list.
An adjacency list can be implemented in JavaScript by creating two classes, a Node class and a Graph class. The Node class will consist of a constructor and a connect() method to join two vertices. It will also have the isConnected() and getAdjacentNodes() methods which work in exactly the same manner as shown above.
class Node {
  constructor(value) {
    this.value = value;
    this.edgesList = [];
  }
  connect(node) {
    this.edgesList.push(node);
    node.edgesList.push(this);
  }
  getAdjNodes() {
    return this.edgesList.map((edge) => edge.value);
  }
  isConnected(node) {
    return this.edgesList.map((edge) =>
    edge.value).indexOf(node.value) > -1;
  }
}
The Graph class consists of a constructor and the addToGraph() method which adds a new vertex to the graph.
class Graph {
  constructor(nodes) {
    this.nodes = [...nodes];
  }
  addToGraph(node) {
    this.nodes.push(node);
  }
}
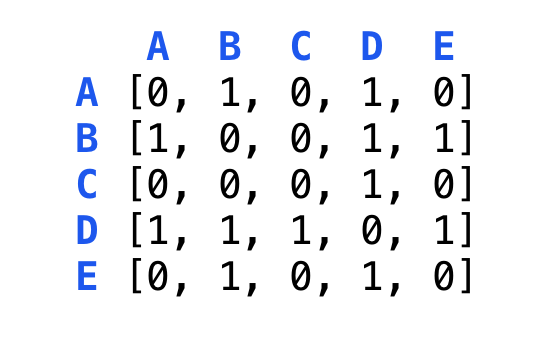
Adjacency Matrix
A 2-D array where each array represents a vertex and each index represents a possible connection between vertices. An adjacency matrix is filled with 0s and 1s, with 1 representing a connection. The value at adjacencyMatrix[node1][node2] will show whether or not there is a connection between the two specified vertices. Below is is a graph and its visual representation as an adjacency matrix.
To implement this adjacency matrix in JavaScript, we start by creating two classes, the first being the Node class:
class Node {
  constructor(value) {
    this.value = value;
  }
}
We then create the Graph class which will contain the constructor for creating the 2-D array initialized with zeros.
class Graph {
  constructor(nodes) {
    this.nodes = [...nodes];
    this.adjacencyMatrix = Array.from({ length: nodes.length },
    () => Array(nodes.length).fill(0));
   }
}
We will then add the addNode() method which will be used to add new vertices to the graph.
  addNode(node) {
    this.nodes.push(node);
    this.adjacencyMatrix.forEach((row) => row.push(0));
    this.adjacencyMatrix.push(new Array(this.nodes.length).fill(0));
  }
Next is the connect() method which will add an edge between two vertices.
  connect(node1, node2) {
    const index1 = this.nodes.indexOf(node1);
    const index2 = this.nodes.indexOf(node2);

    if (index1 > -1 && index2 > -1) {
      this.adjacencyMatrix[index1][index2] = 1;
      this.adjacencyMatrix[index2][index1] = 1;
    }
  }
We will also create the isConnected() method which can be used to check if two vertices are connected.
  isConnected(node1, node2) {
    const index1 = this.nodes.indexOf(node1);
    const index2 = this.nodes.indexOf(node2);

    if (index1 > -1 && index2 > -1) {
      return this.adjacencyMatrix[index1][index2] === 1;
    }
    return false;
  }
Lastly we will add the printAdjacencyMatrix() method to the Graph class.
  printAdjacencyMatrix() {
    console.log(this.adjacencyMatrix);
  }
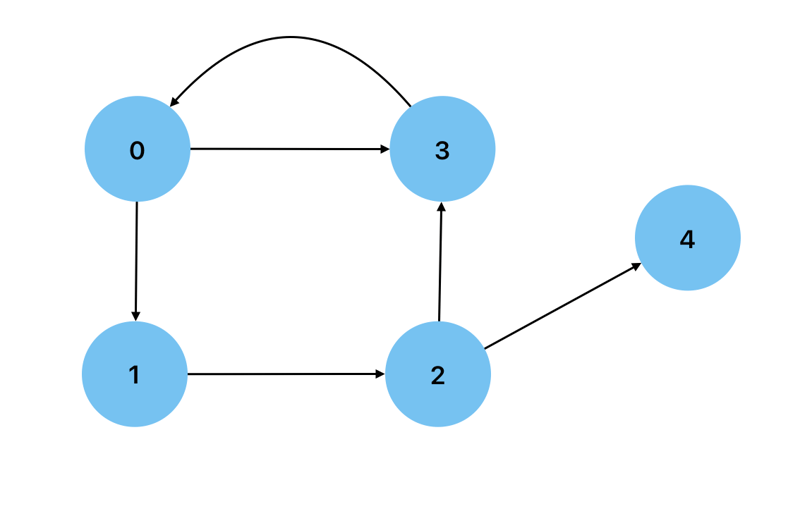
Breadth First Search
Similar to a Breadth First Search in a tree, the vertices adjacent to the current vertex are visited before visiting any subsequent children. A queue is the data structure of choice when performing a Breadth First Search on a graph.
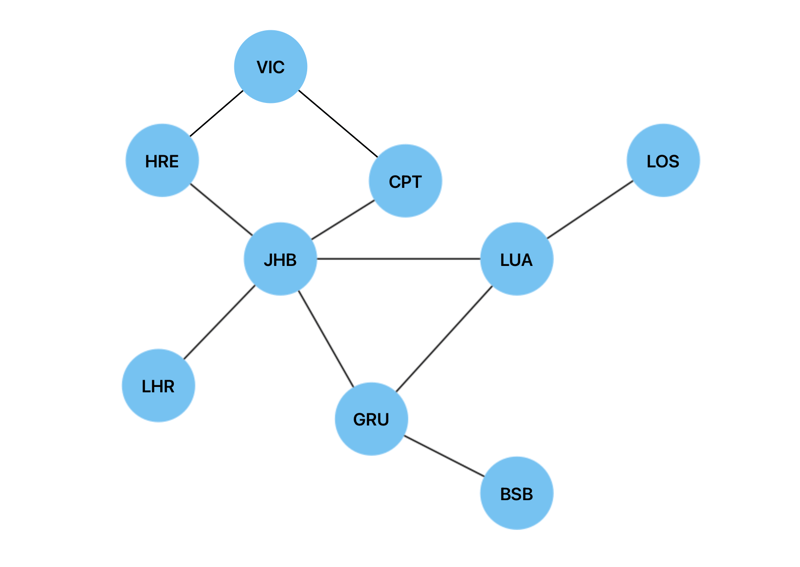
Below is a graph of international airports and their connections and we will use a Breadth First Search to find the shortest route(path) between two airports(vertices).
In order to implement this search algorithm in JavaScript, we will use the same Node and Graph classes we implemented the adjacency list above. We will create a breadthFirstTraversal() method and add it to the Graph class in order to traverse between two given vertices. This method will have the visitedNodes object, which will be used to store the visited vertices and their predecessors. It is initiated as null to show that the first vertex in our search has no predecessors.
breathFirstTraversal(start, end) {
    const queue = [start];
    const visitedNodes = {};
    visitedNodes[start.value] = null;

    while (queue.length > 0) {
      const node = queue.shift();

      if (node.value === end.value) {
        return this.reconstructedPath(visitedNodes, end);
      }
      for (const adjacency of node.edgesList) {
        if (!visitedNodes.hasOwnProperty(adjacency.value)) {
          visitedNodes[adjacency.value] = node;
          queue.push(adjacency);
        }
      }
    }
  }
Once the end vertex is found, we will use the reconstructedPath() method in the Graph class in order to return the shortest path between two vertices. Each vertex is added iteratively to the shortestPath array, which in turn must be reversed in order to come up with the correct order for the shortest path.
reconstructedPath(visitedNodes, endNode) {
    let currNode = endNode;

    const shortestPath = [];

    while (currNode !== null) {
      shortestPath.push(currNode.value);
      currNode = visitedNodes[currNode.value];
    }
    return shortestPath.reverse();
  }
In the case of the graph of international airports, breathFirstTraversal(JHB, LOS) will return JHB -> LUA -> LOS as the shortest path. In the case of a weighted graph, we would use Dijkstra's algorithm to find the shortest path.
Depth First Search
Similar to a depth first search in a tree, this algorithm will fully explore every descendant of a vertex, before backtracking to the root. A stack is the data structure of choice for depth first traversals in a graph.
A depth first search can be used to detect a cycle in a graph. We will use the same graph of international airports to illustrate this in JavaScript.
Similar to the Breadth First Search algorithm above, this implementation of a Depth First Search algorithm in JavaScript will use the previously created Node and Graph classes. We will create a helper function called depthFirstTraversal() and add it to the Graph class.
  depthFirstTraversal(start, visitedNodes = {}, parent = null) {
    visitedNodes[start.value] = true;

    for (const adjacency of start.edgesList) {
      if (!visitedNodes[adjacency.value]) {
        if (this.depthFirstTraversal(adjacency, visitedNodes, start)) {
          return true;
        }
      } else if (adjacency !== parent) {
        return true;
      }
    }

    return false;
  }
This will perform the Depth First Traversal of the graph, using the parent parameter to keep track of the previous vertex and prevent the detection of a cycle when revisiting the parent vertex. Visited vertices will be marked as true in the visitedNodes object. This method will then use recursion to visit previously unvisited vertices. If the vertex has already been visited, we check it against the parent parameter. A cycle has been found if the vertex has already been visited and it is not the parent.
We will also create the wrapper function hasCycle() in the Graph class. This function is used to detect a cycle in a disconnected graph. It will initialize the visitedNodes object and loop through all of the vertices in the graph.
hasCycle() {
    const visitedNodes = {};

    for (const node of this.nodes) {
      if (!visitedNodes[node.value]) {
        if (this.depthFirstTraversal(node, visitedNodes)) {
          return true;
        }
      }
    }
    return false;
  }
In the case of the graph of international airports, the code will return true.
Depth First Traversal of a graph is also useful for pathfinding(not necessarily shortest path) and for solving mazes.
결론
데이터 구조와 알고리즘에 대한 연구를 진행하려면 데이터 구조로서의 그래프와 관련 알고리즘에 대한 확고한 이해가 절대적으로 필요합니다. 이 시리즈의 이전 게시물만큼 초보자에게 친숙하지는 않지만 이 가이드는 데이터 구조와 알고리즘에 대한 이해를 심화하는 데 유용할 것입니다.
The above is the detailed content of Data Structures and Algorithms: Graphs. For more information, please follow other related articles on the PHP Chinese website!

Hot AI Tools

Undresser.AI Undress
AI-powered app for creating realistic nude photos

AI Clothes Remover
Online AI tool for removing clothes from photos.

Undress AI Tool
Undress images for free

Clothoff.io
AI clothes remover

AI Hentai Generator
Generate AI Hentai for free.

Hot Article
Hot Tools

Notepad++7.3.1
Easy-to-use and free code editor

SublimeText3 Chinese version
Chinese version, very easy to use

Zend Studio 13.0.1
Powerful PHP integrated development environment

Dreamweaver CS6
Visual web development tools

SublimeText3 Mac version
God-level code editing software (SublimeText3)
Hot Topics
 1376
1376
 52
52

 How do I create and publish my own JavaScript libraries?
Mar 18, 2025 pm 03:12 PM
How do I create and publish my own JavaScript libraries?
Mar 18, 2025 pm 03:12 PM
Article discusses creating, publishing, and maintaining JavaScript libraries, focusing on planning, development, testing, documentation, and promotion strategies.
 How do I optimize JavaScript code for performance in the browser?
Mar 18, 2025 pm 03:14 PM
How do I optimize JavaScript code for performance in the browser?
Mar 18, 2025 pm 03:14 PM
The article discusses strategies for optimizing JavaScript performance in browsers, focusing on reducing execution time and minimizing impact on page load speed.
 What should I do if I encounter garbled code printing for front-end thermal paper receipts?
Apr 04, 2025 pm 02:42 PM
What should I do if I encounter garbled code printing for front-end thermal paper receipts?
Apr 04, 2025 pm 02:42 PM
Frequently Asked Questions and Solutions for Front-end Thermal Paper Ticket Printing In Front-end Development, Ticket Printing is a common requirement. However, many developers are implementing...
 How do I debug JavaScript code effectively using browser developer tools?
Mar 18, 2025 pm 03:16 PM
How do I debug JavaScript code effectively using browser developer tools?
Mar 18, 2025 pm 03:16 PM
The article discusses effective JavaScript debugging using browser developer tools, focusing on setting breakpoints, using the console, and analyzing performance.
 How do I use source maps to debug minified JavaScript code?
Mar 18, 2025 pm 03:17 PM
How do I use source maps to debug minified JavaScript code?
Mar 18, 2025 pm 03:17 PM
The article explains how to use source maps to debug minified JavaScript by mapping it back to the original code. It discusses enabling source maps, setting breakpoints, and using tools like Chrome DevTools and Webpack.
 TypeScript for Beginners, Part 2: Basic Data Types
Mar 19, 2025 am 09:10 AM
TypeScript for Beginners, Part 2: Basic Data Types
Mar 19, 2025 am 09:10 AM
Once you have mastered the entry-level TypeScript tutorial, you should be able to write your own code in an IDE that supports TypeScript and compile it into JavaScript. This tutorial will dive into various data types in TypeScript. JavaScript has seven data types: Null, Undefined, Boolean, Number, String, Symbol (introduced by ES6) and Object. TypeScript defines more types on this basis, and this tutorial will cover all of them in detail. Null data type Like JavaScript, null in TypeScript
 How do I use Java's collections framework effectively?
Mar 13, 2025 pm 12:28 PM
How do I use Java's collections framework effectively?
Mar 13, 2025 pm 12:28 PM
This article explores effective use of Java's Collections Framework. It emphasizes choosing appropriate collections (List, Set, Map, Queue) based on data structure, performance needs, and thread safety. Optimizing collection usage through efficient
 Getting Started With Chart.js: Pie, Doughnut, and Bubble Charts
Mar 15, 2025 am 09:19 AM
Getting Started With Chart.js: Pie, Doughnut, and Bubble Charts
Mar 15, 2025 am 09:19 AM
This tutorial will explain how to create pie, ring, and bubble charts using Chart.js. Previously, we have learned four chart types of Chart.js: line chart and bar chart (tutorial 2), as well as radar chart and polar region chart (tutorial 3). Create pie and ring charts Pie charts and ring charts are ideal for showing the proportions of a whole that is divided into different parts. For example, a pie chart can be used to show the percentage of male lions, female lions and young lions in a safari, or the percentage of votes that different candidates receive in the election. Pie charts are only suitable for comparing single parameters or datasets. It should be noted that the pie chart cannot draw entities with zero value because the angle of the fan in the pie chart depends on the numerical size of the data point. This means any entity with zero proportion
