

Visualizing Options Flow with Python: A Step-by-Step Guide

In the ever-evolving world of finance, visualizing data can offer unprecedented insights into market trends. In this article, we’ll explore how to leverage Python for a specific financial analysis task: visualizing options flow for a given stock using historical data from Yahoo Finance. We’ll be using a code snippet that fetches options data, processes it, and generates a scatter plot to illustrate the flow of call and put options. Let’s dive into the details.
Getting Started
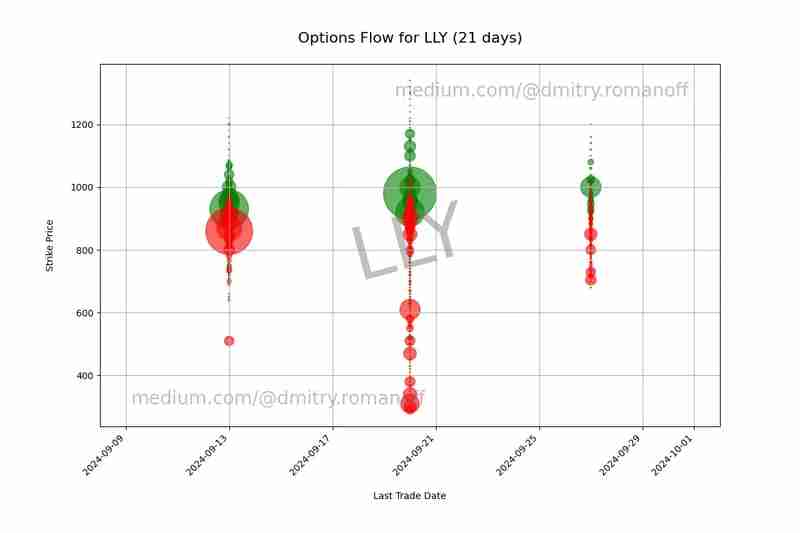
Our goal is to analyze the options data for a particular stock and visualize it in a scatter plot. For this example, we’ll use the stock ticker LLY (Eli Lilly and Company). The code snippet accomplishes the following:
- Retrieves the latest options data for the specified stock.
- Filters and cleans the data.
- Creates a scatter plot to represent call and put options over time.
Step-by-Step Breakdown
1. Importing Libraries
First, we need to import the necessary libraries:
1 2 3 4 5 |
|
- yfinance is used to fetch historical stock data.
- os handles directory and file operations.
- datetime and timedelta are for managing dates.
- matplotlib.pyplot is for creating visualizations.
- pandas is for data manipulation and analysis.
2. Setting Up Directories and Files
We set up the output directory and file where we will save our data:
1 2 3 |
|
Here, we ensure that the output directory exists and specify the path for the data file.
3. Fetching and Processing Options Data
To get options data for the ticker LLY, we use yfinance:
1 2 3 |
|
If populate_data is set to 'Y', the code fetches new options data. If 'N', it will use the existing data file.
Here’s how the data fetching and processing is done:
1 2 3 4 5 6 7 8 9 10 11 12 13 14 15 16 17 18 19 20 21 22 23 |
|
This code fetches call and put options data, filters out rows with unwanted volume data, and writes it to a file.
4. Cleaning and Preparing Data for Visualization
Next, we read the data and clean it:
1 2 3 4 |
|
We ensure that our dataset is free of NaN values and that the Last_Trade_Date is in the correct datetime format.
5. Creating the Scatter Plot
We’re ready to create our scatter plot:
1 2 3 4 5 6 7 8 9 10 11 12 13 14 15 16 17 18 19 20 21 22 23 24 25 26 27 28 29 30 31 32 33 34 35 36 |
|
This segment creates a scatter plot of call and put options, with strike prices on the y-axis and trade dates on the x-axis. The size of the points represents the volume of trades, with green indicating calls and red indicating puts. We also add watermarks for branding purposes and save the plot to a file.
Conclusion
Visualizing options data helps traders and analysts understand market sentiment and trading activity. This guide demonstrated how to fetch, process, and visualize options data using Python. By following these steps, you can adapt this code for any stock and analyze its options flow, providing valuable insights into market trends.
Feel free to modify the code to fit your specific needs and explore different ways to visualize financial data.
The above is the detailed content of Visualizing Options Flow with Python: A Step-by-Step Guide. For more information, please follow other related articles on the PHP Chinese website!

Hot AI Tools

Undresser.AI Undress
AI-powered app for creating realistic nude photos

AI Clothes Remover
Online AI tool for removing clothes from photos.

Undress AI Tool
Undress images for free

Clothoff.io
AI clothes remover

Video Face Swap
Swap faces in any video effortlessly with our completely free AI face swap tool!
Hot Article
Hot Tools

Notepad++7.3.1
Easy-to-use and free code editor

SublimeText3 Chinese version
Chinese version, very easy to use

Zend Studio 13.0.1
Powerful PHP integrated development environment

Dreamweaver CS6
Visual web development tools

SublimeText3 Mac version
God-level code editing software (SublimeText3)
Hot Topics
 1662
1662
 14
1418
52
1311
25
1261
29
1234
24
14
1418
52
1311
25
1261
29
1234
24

 Python vs. C : Applications and Use Cases Compared
Apr 12, 2025 am 12:01 AM
Python vs. C : Applications and Use Cases Compared
Apr 12, 2025 am 12:01 AM
Python is suitable for data science, web development and automation tasks, while C is suitable for system programming, game development and embedded systems. Python is known for its simplicity and powerful ecosystem, while C is known for its high performance and underlying control capabilities.
 Python: Games, GUIs, and More
Apr 13, 2025 am 12:14 AM
Python: Games, GUIs, and More
Apr 13, 2025 am 12:14 AM
Python excels in gaming and GUI development. 1) Game development uses Pygame, providing drawing, audio and other functions, which are suitable for creating 2D games. 2) GUI development can choose Tkinter or PyQt. Tkinter is simple and easy to use, PyQt has rich functions and is suitable for professional development.
 The 2-Hour Python Plan: A Realistic Approach
Apr 11, 2025 am 12:04 AM
The 2-Hour Python Plan: A Realistic Approach
Apr 11, 2025 am 12:04 AM
You can learn basic programming concepts and skills of Python within 2 hours. 1. Learn variables and data types, 2. Master control flow (conditional statements and loops), 3. Understand the definition and use of functions, 4. Quickly get started with Python programming through simple examples and code snippets.
 How Much Python Can You Learn in 2 Hours?
Apr 09, 2025 pm 04:33 PM
How Much Python Can You Learn in 2 Hours?
Apr 09, 2025 pm 04:33 PM
You can learn the basics of Python within two hours. 1. Learn variables and data types, 2. Master control structures such as if statements and loops, 3. Understand the definition and use of functions. These will help you start writing simple Python programs.
 Python vs. C : Learning Curves and Ease of Use
Apr 19, 2025 am 12:20 AM
Python vs. C : Learning Curves and Ease of Use
Apr 19, 2025 am 12:20 AM
Python is easier to learn and use, while C is more powerful but complex. 1. Python syntax is concise and suitable for beginners. Dynamic typing and automatic memory management make it easy to use, but may cause runtime errors. 2.C provides low-level control and advanced features, suitable for high-performance applications, but has a high learning threshold and requires manual memory and type safety management.
 Python and Time: Making the Most of Your Study Time
Apr 14, 2025 am 12:02 AM
Python and Time: Making the Most of Your Study Time
Apr 14, 2025 am 12:02 AM
To maximize the efficiency of learning Python in a limited time, you can use Python's datetime, time, and schedule modules. 1. The datetime module is used to record and plan learning time. 2. The time module helps to set study and rest time. 3. The schedule module automatically arranges weekly learning tasks.
 Python: Exploring Its Primary Applications
Apr 10, 2025 am 09:41 AM
Python: Exploring Its Primary Applications
Apr 10, 2025 am 09:41 AM
Python is widely used in the fields of web development, data science, machine learning, automation and scripting. 1) In web development, Django and Flask frameworks simplify the development process. 2) In the fields of data science and machine learning, NumPy, Pandas, Scikit-learn and TensorFlow libraries provide strong support. 3) In terms of automation and scripting, Python is suitable for tasks such as automated testing and system management.
 Python: Automation, Scripting, and Task Management
Apr 16, 2025 am 12:14 AM
Python: Automation, Scripting, and Task Management
Apr 16, 2025 am 12:14 AM
Python excels in automation, scripting, and task management. 1) Automation: File backup is realized through standard libraries such as os and shutil. 2) Script writing: Use the psutil library to monitor system resources. 3) Task management: Use the schedule library to schedule tasks. Python's ease of use and rich library support makes it the preferred tool in these areas.
