
 Web Front-end
JS Tutorial
Building an Interactive XY Image Plot with Google Apps Script and Leaflet.js
Web Front-end
JS Tutorial
Building an Interactive XY Image Plot with Google Apps Script and Leaflet.js
Building an Interactive XY Image Plot with Google Apps Script and Leaflet.js

Google Maps has a ton of features for plotting points on a map, but what if you want to plot points on an image? These XY Image Plot maps are commonly used for floor maps, job site inspections, and even games.
In this guide, I'll show you how to create an interactive map with draggable points using Leaflet.js and Google Apps Script. We'll cover everything from setting up the map to integrating data from Google Sheets, and deploying it as a web app.
This guide will cover:
Setting up Leaflet.js in a Google Apps Script HTML Service
Displaying Markers using data from Google Sheets
Updating Sheets row when a Marker is moved
Creating new Markers from the map and saving to Sheets
Deleting a marker from the web app
Setting up Leaflet.js in a Google Apps Script HTML Service
Leaflet.js is one of the most popular open-source mapping libraries. It's light-weight, easy to use, and had great documentation. They support a ton of different map types, including "CRS.Simple", or Coordinate Reference System, which allows you to supply a background image.
Google Sheets Set Up
Start out by creating a sheet named map_pin with the following structure:
| id | title | x | y |
|---|---|---|---|
| 1 | test1 | 10 | 30 |
| 2 | test2 | 50 | 80 |
然後從「擴充功能」選單開啟 Apps 腳本。
建立 HTML 文件
首先,我們將從 Leaflet 文件中的基本範例開始,以使程式庫正常運作。您可以在此處查看其快速入門指南中的完整範例。
新增一個新的HTML文件,命名為Index,並將內容設為:
<!DOCTYPE html>
<html>
<head>
<title>Quick Start - Leaflet</title>
<meta charset="utf-8" />
<meta name="viewport" content="width=device-width, initial-scale=1.0">
<link rel="stylesheet" href="https://unpkg.com/leaflet@1.9.3/dist/leaflet.css" />
<style>
#map {
height: 400px;
}
</style>
</head>
<body>
<div id="map"></div>
<script src="https://unpkg.com/leaflet@1.9.3/dist/leaflet.js"></script>
<script>
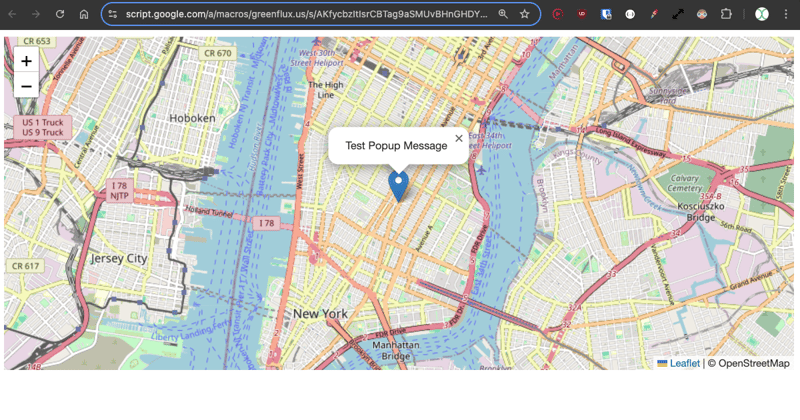
var map = L.map('map').setView([40.73, -73.99], 13);
L.tileLayer('https://{s}.tile.openstreetmap.org/{z}/{x}/{y}.png', {
maxZoom: 19,
attribution: '© OpenStreetMap'
}).addTo(map);
var marker = L.marker([40.73, -73.99]).addTo(map)
.bindPopup('Test Popup Message')
.openPopup();
</script>
</body>
</html>
然後使用以下內容更新 Code.gs 檔案:
function doGet() {
  const html = HtmlService.createHtmlOutputFromFile('Index')
    .setTitle('Map with Draggable Points')
    .setXFrameOptionsMode(HtmlService.XFrameOptionsMode.ALLOWALL);
  return html;
}
儲存,然後按一下部署,並發佈為 Web 應用程式。然後打開新部署的鏈接,您應該會看到 Leaflet.js 顯示紐約的地圖。
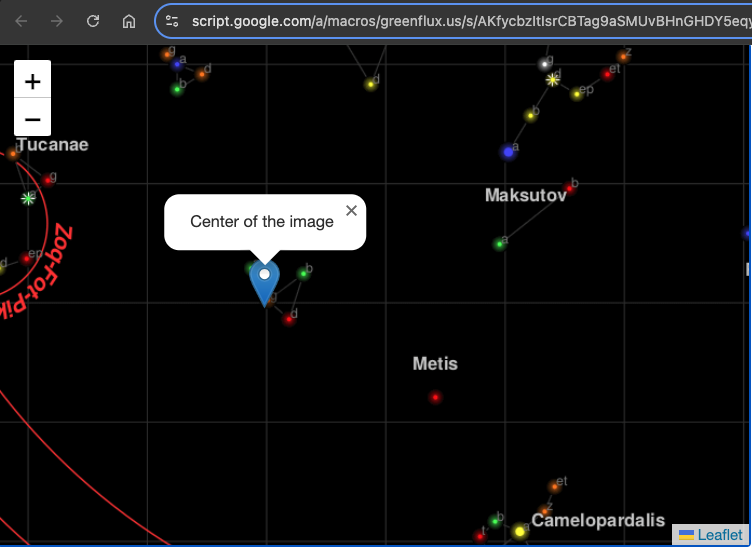
好的,這就是使用 Leaflet 的常規地圖範例。現在介紹 CRS.Simple 地圖類型,它允許提供背景圖片。
使用傳單教學中的範例更新 HTML。
<!DOCTYPE html>
<html>
<head>
  <title>CRS Simple Example - Leaflet</title>
  <meta charset="utf-8" />
  <meta name="viewport" content="width=device-width, initial-scale=1.0">
  <link rel="stylesheet" href="https://unpkg.com/leaflet@1.9.3/dist/leaflet.css" />
  <style>
    #map {
      height: 400px;
      width: 600px;
    }
    body {
      margin: 0;
      padding: 0;
    }
  </style>
</head>
<body>
  <div id="map"></div>

  <script src="https://unpkg.com/leaflet@1.9.3/dist/leaflet.js"></script>
  <script>
    // Set up the map with a simple CRS (no geographic projection)
    var map = L.map('map', {
      crs: L.CRS.Simple,
      minZoom: -1,
      maxZoom: 4
    });

    // Define the dimensions of the image
    var bounds = [[0, 0], [1000, 1000]];
    var image = L.imageOverlay('https://leafletjs.com/examples/crs-simple/uqm_map_full.png', bounds).addTo(map);

    // Set the initial view of the map to show the whole image
    map.fitBounds(bounds);

    // Optional: Add a marker or other elements to the map
    var marker = L.marker([500, 500]).addTo(map)
      .bindPopup('Center of the image')
      .openPopup();
  </script>
</body>
</html>
這裡我們提供一張 1000 x 1000 像素的圖像,然後將中心標記設為 500、500。
點選儲存,然後部署>測試部署,查看新的地圖類型。現在您應該擁有一張帶有背景圖像並在中心繪製了標記的地圖。
使用 Google 表格中的資料初始化地圖
接下來,我們將使用工作表中的資料來填入地圖上的一組標記。
首先,在 Code.gs 檔案中加入一個函數來取得標記位置:
function getPinData(){
  const ss = SpreadsheetApp.getActiveSpreadsheet();
  const sh = ss.getSheetByName('map_pin');
  const data = sh.getDataRange().getValues();
  const json = arrayToJSON(data);
  //Logger.log(json);
  return json
}

function arrayToJSON(data=getPinData()){
  const headers = data[0];
  const rows = data.slice(1);
  let jsonData = [];
  for(row of rows){
    const obj = {};
    headers.forEach((h,i)=>obj[h] = row[i]);
    jsonData.push(obj)
  }
  //Logger.log(jsonData)
  return jsonData
}
在這裡,我以 JSON 形式傳回引腳,以便在下一節中更容易在 HTML 中使用它們。
現在為 HTML 添加一個函數以循環此 JSON 並在地圖載入後建立地圖圖釘。
// Add map pins from sheet data
    google.script.run.withSuccessHandler(addMarkers).getPinData();

    function addMarkers(mapPinData) {
      mapPinData.forEach(pin => {
        const marker = L.marker([pin.x, pin.y], {
          draggable: true
        }).addTo(map);

        marker.bindPopup(`<b>${pin.title}`).openPopup();

        marker.on('dragend', function(e) {
          const latLng = e.target.getLatLng();
          console.log(`Marker ${pin.title} moved to: ${latLng.lat}, ${latLng.lng}`);
        });
      });
    }
儲存,然後開啟測試部署。現在您應該已經從工作表資料產生了標記!
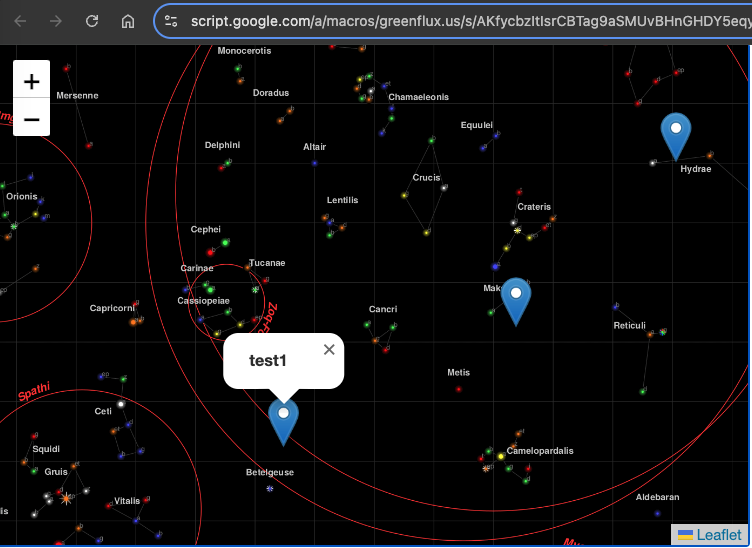
每個圖釘都有一個彈出窗口,其中包含該行的標題。此時圖釘可以拖曳,但我們仍然需要一個函數來儲存新位置。
拖曳時儲存標記位置
要保存新位置,我們需要兩個函數:一個在 HTML 中用於捕獲客戶端的事件,另一個用於在伺服器端的 Code.gs 檔案中保存新位置。
使用以下內容更新 HTML:
    function addMarkers(mapPinData) {
      mapPinData.forEach(pin => {
        const { id, title, x, y } = pin;
        const marker = L.marker([x, y], {
          draggable: true
        }).addTo(map);

        marker.bindPopup(`<b>${title}</b>`).openPopup();

        marker.on('dragend', function(e) {
          const latLng = e.target.getLatLng();
          console.log(`Marker ${title} moved to: ${latLng.lat}, ${latLng.lng}`);
          saveMarkerPosition({ id, title, lat: latLng.lat, lng: latLng.lng });
        });
      });
    }

    function saveMarkerPosition({ id, title, lat, lng }) {
      google.script.run.saveMarkerPosition({ id, title, lat, lng });
    }
然後在Code.gs檔案中加入一個函數來儲存位置:
function saveMarkerPosition({ id, lat, lng }) {
  const ss = SpreadsheetApp.getActiveSpreadsheet();
  const sh = ss.getSheetByName('map_pin');
  const data = sh.getDataRange().getValues();

  for (let i = 1; i < data.length; i++) {
    if (data[i][0] === id) {  // ID column (index 0)
      sh.getRange(i + 1, 3).setValue(lat);  // latitude column
      sh.getRange(i + 1, 4).setValue(lng);  // longitude column
      break;
    }
  }
}
儲存並重新整理測試部署。現在,當拖曳標記時,您應該會看到工作表更新!
新增點
我們現在可以移動現有的點,但是增加新的點怎麼樣?同樣,我們需要兩個函數,一個在 HTML 中,一個在 Code.gs 檔案中。
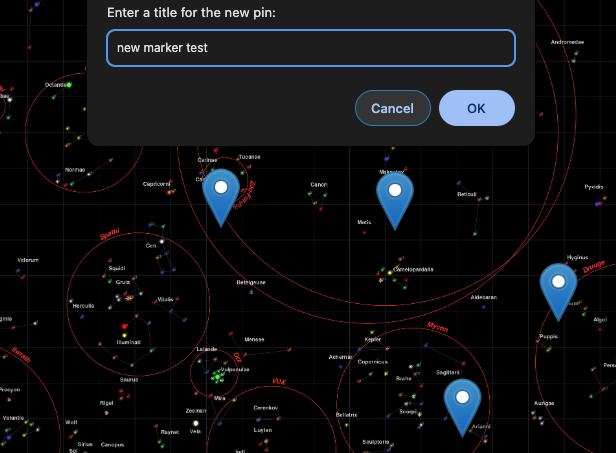
首先,在 HTML 中新增一個函數,以便在使用者點擊地圖上的空白點時開啟提示,並將值傳遞給伺服器函數。
    // Function to add a new pin
    map.on('click', function(e) {
      const latLng = e.latlng;
      const title = prompt('Enter a title for the new pin:');
      if (title) {
        google.script.run.withSuccessHandler(function(id) {
          addNewMarker({ id, title, lat: latLng.lat, lng: latLng.lng });
        }).addNewPin({ title, lat: latLng.lat, lng: latLng.lng });
      }
    });

    function addNewMarker({ id, title, lat, lng }) {
      const marker = L.marker([lat, lng], {
        draggable: true
      }).addTo(map);

      marker.bindPopup(`<b>${title}</b>`).openPopup();

      marker.on('dragend', function(e) {
        const latLng = e.target.getLatLng();
        saveMarkerPosition({ id, title, lat: latLng.lat, lng: latLng.lng });
      });
    }
然後將函數新增至 Code.gs 以儲存新行。
function addNewPin({ title, lat, lng }) {
  const ss = SpreadsheetApp.getActiveSpreadsheet();
  const sh = ss.getSheetByName('map_pin');

  // Check if there are any rows present, if not initialize ID
  const lastRow = sh.getLastRow();
  let newId = 1;

  if (lastRow > 0) {
    const lastId = sh.getRange(lastRow, 1).getValue();
    newId = lastId + 1;
  }

  sh.appendRow([newId, title, lat, lng]);

  return newId;
}
再次儲存並重新整理測試部署。現在,當您單擊空白處時,您可以輸入標題並儲存新標記!
刪除標記
最後,我們應該添加一種刪除標記的方法,從而在地圖視圖中為我們提供完整的 CRUD 應用程式。
更新新增標記功能,提供彈出視窗刪除按鈕:
      const popupContent = `<b>${title}</b><br><button onclick="deleteMarker(${id})">Delete Marker</button>`;
      marker.bindPopup(popupContent).openPopup();
然後新增客戶端刪除的功能:
// Function to delete a marker
  function deleteMarker(id) {
    const confirmed = confirm('Are you sure you want to delete this marker?');
    if (confirmed) {
      google.script.run.withSuccessHandler(() => {
        // Refresh the markers after deletion
        google.script.run.withSuccessHandler(addMarkers).getPinData();
      }).deleteMarker(id);
    }
  }
然後將符合的函數加入Code.gs檔案:
function deleteMarker(id) {
  const ss = SpreadsheetApp.getActiveSpreadsheet();
  const sh = ss.getSheetByName('map_pin');
  const data = sh.getDataRange().getValues();

  for (let i = 1; i < data.length; i++) {
    if (data[i][0] === id) {  // ID column (index 0)
      sh.deleteRow(i + 1);  // Delete the row
      break;
    }
  }
}
接下來是什麼?
您也可以從這裡做很多事情,例如向每個標記添加其他資料點、動態背景圖像或其他點擊和拖曳互動。你甚至可以製作遊戲!有用例的想法嗎?在下面發表評論!
The above is the detailed content of Building an Interactive XY Image Plot with Google Apps Script and Leaflet.js. For more information, please follow other related articles on the PHP Chinese website!

Hot AI Tools

Undresser.AI Undress
AI-powered app for creating realistic nude photos

AI Clothes Remover
Online AI tool for removing clothes from photos.

Undress AI Tool
Undress images for free

Clothoff.io
AI clothes remover

Video Face Swap
Swap faces in any video effortlessly with our completely free AI face swap tool!

Hot Article
Hot Tools

Notepad++7.3.1
Easy-to-use and free code editor

SublimeText3 Chinese version
Chinese version, very easy to use

Zend Studio 13.0.1
Powerful PHP integrated development environment

Dreamweaver CS6
Visual web development tools

SublimeText3 Mac version
God-level code editing software (SublimeText3)
Hot Topics
 1664
1664
 14
1423
52
1317
25
1268
29
1242
24
14
1423
52
1317
25
1268
29
1242
24

 Demystifying JavaScript: What It Does and Why It Matters
Apr 09, 2025 am 12:07 AM
Demystifying JavaScript: What It Does and Why It Matters
Apr 09, 2025 am 12:07 AM
JavaScript is the cornerstone of modern web development, and its main functions include event-driven programming, dynamic content generation and asynchronous programming. 1) Event-driven programming allows web pages to change dynamically according to user operations. 2) Dynamic content generation allows page content to be adjusted according to conditions. 3) Asynchronous programming ensures that the user interface is not blocked. JavaScript is widely used in web interaction, single-page application and server-side development, greatly improving the flexibility of user experience and cross-platform development.
 The Evolution of JavaScript: Current Trends and Future Prospects
Apr 10, 2025 am 09:33 AM
The Evolution of JavaScript: Current Trends and Future Prospects
Apr 10, 2025 am 09:33 AM
The latest trends in JavaScript include the rise of TypeScript, the popularity of modern frameworks and libraries, and the application of WebAssembly. Future prospects cover more powerful type systems, the development of server-side JavaScript, the expansion of artificial intelligence and machine learning, and the potential of IoT and edge computing.
 JavaScript Engines: Comparing Implementations
Apr 13, 2025 am 12:05 AM
JavaScript Engines: Comparing Implementations
Apr 13, 2025 am 12:05 AM
Different JavaScript engines have different effects when parsing and executing JavaScript code, because the implementation principles and optimization strategies of each engine differ. 1. Lexical analysis: convert source code into lexical unit. 2. Grammar analysis: Generate an abstract syntax tree. 3. Optimization and compilation: Generate machine code through the JIT compiler. 4. Execute: Run the machine code. V8 engine optimizes through instant compilation and hidden class, SpiderMonkey uses a type inference system, resulting in different performance performance on the same code.
 Python vs. JavaScript: The Learning Curve and Ease of Use
Apr 16, 2025 am 12:12 AM
Python vs. JavaScript: The Learning Curve and Ease of Use
Apr 16, 2025 am 12:12 AM
Python is more suitable for beginners, with a smooth learning curve and concise syntax; JavaScript is suitable for front-end development, with a steep learning curve and flexible syntax. 1. Python syntax is intuitive and suitable for data science and back-end development. 2. JavaScript is flexible and widely used in front-end and server-side programming.
 JavaScript: Exploring the Versatility of a Web Language
Apr 11, 2025 am 12:01 AM
JavaScript: Exploring the Versatility of a Web Language
Apr 11, 2025 am 12:01 AM
JavaScript is the core language of modern web development and is widely used for its diversity and flexibility. 1) Front-end development: build dynamic web pages and single-page applications through DOM operations and modern frameworks (such as React, Vue.js, Angular). 2) Server-side development: Node.js uses a non-blocking I/O model to handle high concurrency and real-time applications. 3) Mobile and desktop application development: cross-platform development is realized through ReactNative and Electron to improve development efficiency.
 How to Build a Multi-Tenant SaaS Application with Next.js (Frontend Integration)
Apr 11, 2025 am 08:22 AM
How to Build a Multi-Tenant SaaS Application with Next.js (Frontend Integration)
Apr 11, 2025 am 08:22 AM
This article demonstrates frontend integration with a backend secured by Permit, building a functional EdTech SaaS application using Next.js. The frontend fetches user permissions to control UI visibility and ensures API requests adhere to role-base
 Building a Multi-Tenant SaaS Application with Next.js (Backend Integration)
Apr 11, 2025 am 08:23 AM
Building a Multi-Tenant SaaS Application with Next.js (Backend Integration)
Apr 11, 2025 am 08:23 AM
I built a functional multi-tenant SaaS application (an EdTech app) with your everyday tech tool and you can do the same. First, what’s a multi-tenant SaaS application? Multi-tenant SaaS applications let you serve multiple customers from a sing
 From C/C to JavaScript: How It All Works
Apr 14, 2025 am 12:05 AM
From C/C to JavaScript: How It All Works
Apr 14, 2025 am 12:05 AM
The shift from C/C to JavaScript requires adapting to dynamic typing, garbage collection and asynchronous programming. 1) C/C is a statically typed language that requires manual memory management, while JavaScript is dynamically typed and garbage collection is automatically processed. 2) C/C needs to be compiled into machine code, while JavaScript is an interpreted language. 3) JavaScript introduces concepts such as closures, prototype chains and Promise, which enhances flexibility and asynchronous programming capabilities.
