

Introduction To Computer Vision with Python (Part 1)

Note: In this post, we will only be working with Grey-Scale images to make it easy to follow.
What is an Image?
An image can be thought of as a matrix of values, where each value represents the intensity of a pixel. There are three main types of image formats:
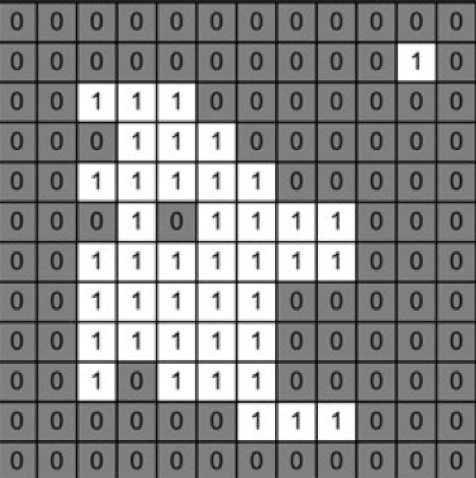
- Binary: An image in this format is represented by a single 2-D matrix with values of 0 (black) and 1 (white). It's the simplest form of image representation.
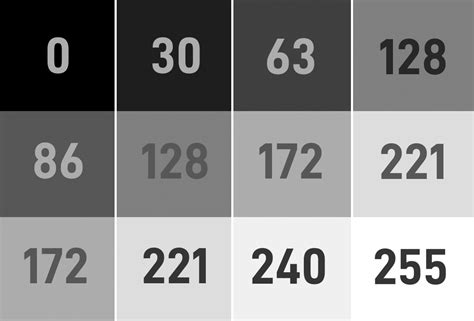
- Grey-Scale: In this format, an image is represented by a single 2-D matrix with values ranging from 0 to 255; where 0 represents black and 255 represents white. The intermediate values represent varying shades of grey.
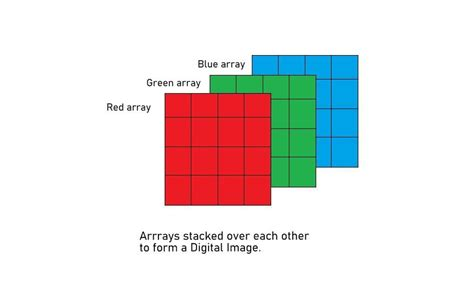
- RGB Scale: Here, an image is represented by three 2-D matrices (one for each color channel: Red, Green, and Blue), with values ranging from 0 to 255. Each matrix contains pixel values for one color component, and combining these three channels gives us the full color image.
Filters
Filters are tools used to modify images by applying certain operations. A filter is a matrix (also called a kernel) that moves across the image, performing computations on the pixel values within its window. We’ll cover two common types of filters: Mean Filters and Median Filters.
Mean Filters
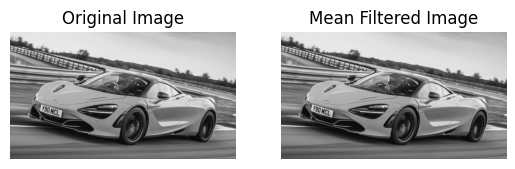
A Mean Filter is used to reduce noise by averaging the pixel values within a window. It replaces the center pixel in the window with the average of all the pixel values within that window. The cv2.blur() function applies a mean filter with a kernel size of 3x3, which means it considers a 3x3 window of pixels around each pixel to compute the average. This helps in smoothing the image.
import cv2
import matplotlib.pyplot as plt

image = cv2.imread('McLaren-720S-Price-1200x675.jpg', cv2.IMREAD_GRAYSCALE)

# Applies a Mean Filter of size 3 x 3
blurred_image = cv2.blur(image, (3, 3))

plt.subplot(1, 2, 1)
plt.imshow(image, cmap='gray')
plt.title('Original Image')
plt.axis("off")

plt.subplot(1, 2, 2)
plt.imshow(blurred_image, cmap='gray')
plt.title('Mean Filtered Image')
plt.axis("off")
plt.show()
Median Filters
A Median Filter is used to reduce noise by replacing each pixel's value with the median value of all pixels in a window. It’s particularly effective in removing salt-and-pepper noise. The cv2.medianBlur() function applies a median filter with a kernel size of 3. This method replaces each pixel with the median value of the pixel values in its neighborhood, which helps in preserving edges while removing noise. Here the larger the kernel size the more blurred the image gets.
import cv2
import matplotlib.pyplot as plt

image = cv2.imread('McLaren-720S-Price-1200x675.jpg', cv2.IMREAD_GRAYSCALE)

# Applies a Median Filter with a kernel size of 3
blurred_image = cv2.medianBlur(image, 3)

plt.subplot(1, 2, 1)
plt.imshow(image, cmap='gray')
plt.title('Original Image')
plt.axis("off")

plt.subplot(1, 2, 2)
plt.imshow(blurred_image, cmap='gray')
plt.title('Median Filtered Image')
plt.axis("off")
plt.show()

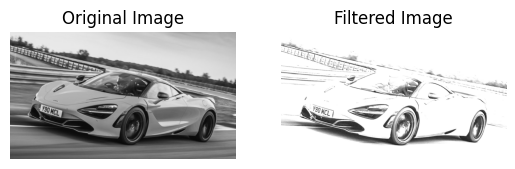
Custom Filters
You can create custom filters to apply specific operations on your images. The cv2.filter2D() function allows you to apply any custom kernel to an image. The cv2.filter2D() function applies a custom kernel (filter) to the image. The kernel is a matrix that defines the operation to be performed on the pixel values. In this example, the kernel enhances certain features of the image based on the specified values.
import cv2
import numpy as np
import matplotlib.pyplot as plt

image = cv2.imread('McLaren-720S-Price-1200x675.jpg', cv2.IMREAD_GRAYSCALE)

# Define a custom filter kernel
kernel = np.array([[2, -1, 5],
                   [-5, 5, -1],
                   [0, -1, 0]])

filtered_image = cv2.filter2D(image, -1, kernel)

plt.subplot(1, 2, 1)
plt.imshow(image, cmap='gray')
plt.title('Original Image')
plt.axis('off')

plt.subplot(1, 2, 2)
plt.imshow(filtered_image, cmap='gray')
plt.title('Filtered Image')
plt.axis('off')

plt.show()
Thresholding
Note: In the code snippets, you will see _ , image when assigning the thresholded image. This is because the cv2.threshold function returns two values: the threshold value used and the thresholded image. Since we only need the thresholded image, we use _ to ignore the threshold value.
Thresholding converts an image into a binary image by setting pixel values based on a condition. There are several types of thresholding techniques:
Global Thresholding
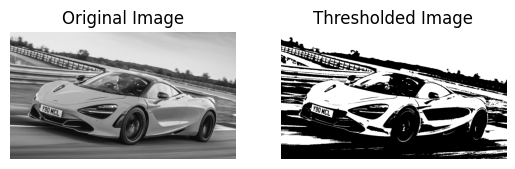
Simple Thresholding
This method sets a fixed threshold value for the entire image. Pixels with values above the threshold are set to the maximum value (255), and those below are set to 0. The cv2.threshold() function is used for simple thresholding. Pixels with intensity greater than 127 are set to white (255), and those with intensity less than or equal to 127 are set to black (0), producing a binary image.
import cv2
import matplotlib.pyplot as plt

image = cv2.imread('McLaren-720S-Price-1200x675.jpg', cv2.IMREAD_GRAYSCALE)

_, thresholded_image = cv2.threshold(image, 127, 255, cv2.THRESH_BINARY)

plt.subplot(1, 2, 1)
plt.imshow(image, cmap='gray')
plt.title('Original Image')
plt.axis("off")

plt.subplot(1, 2, 2)
plt.imshow(thresholded_image, cmap='gray')
plt.title('Thresholded Image')
plt.axis("off")
plt.show()
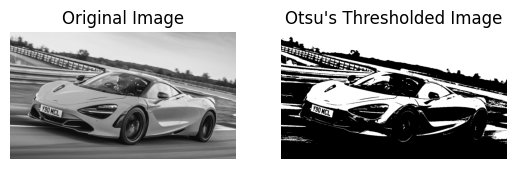
Otsu Thresholding
Otsu's method determines the optimal threshold value automatically based on the histogram of the image. This method minimizes intra-class variance and maximizes inter-class variance. By setting the threshold value to 0 and using cv2.THRESH_OTSU, the function automatically calculates the best threshold value to separate the foreground from the background.
import cv2
import matplotlib.pyplot as plt

image = cv2.imread('McLaren-720S-Price-1200x675.jpg', cv2.IMREAD_GRAYSCALE)

_, otsu_thresholded_image = cv2.threshold(image, 0, 255, cv2.THRESH_BINARY + cv2.THRESH_OTSU)

plt.subplot(1, 2, 1)
plt.imshow(image, cmap='gray')
plt.title('Original Image')
plt.axis("off")

plt.subplot(1, 2, 2)
plt.imshow(otsu_thresholded_image, cmap='gray')
plt.title("Otsu's Thresholded Image")
plt.axis("off")
plt.show()
Adaptive Thresholding
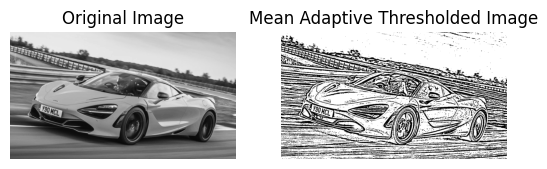
Mean Adaptive Thresholding
In Mean Adaptive Thresholding, the threshold value for each pixel is calculated based on the average of pixel values in a local neighborhood around that pixel. This method adjusts the threshold dynamically across different regions of the image. The cv2.adaptiveThreshold() function calculates the threshold for each pixel based on the mean value of the pixel values in a local 11x11 neighborhood. A constant value of 2 is subtracted from this mean to fine-tune the threshold. This method is effective for images with varying lighting conditions.
import cv2
import matplotlib.pyplot as plt

image = cv2.imread('McLaren-720S-Price-1200x675.jpg', cv2.IMREAD_GRAYSCALE)

mean_adaptive_thresholded_image = cv2.adaptiveThreshold(image, 255, cv2.ADAPTIVE_THRESH_MEAN_C, cv2.THRESH_BINARY, 11, 2)

plt.subplot(1, 2, 1)
plt.imshow(image, cmap='gray')
plt.title('Original Image')
plt.axis("off")

plt.subplot(1, 2, 2)
plt.imshow(mean_adaptive_thresholded_image, cmap='gray')
plt.title('Mean Adaptive Thresholded Image')
plt.axis("off")
plt.show()
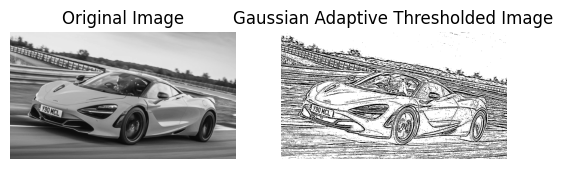
Gaussian Adaptive Thresholding
Gaussian Adaptive Thresholding computes the threshold value for each pixel based on a Gaussian-weighted sum of the pixel values in a local neighborhood. This method often provides better results in cases with non-uniform illumination. In Gaussian Adaptive Thresholding, the threshold is determined by a Gaussian-weighted sum of pixel values in an 11x11 neighborhood. The constant value 2 is subtracted from this weighted mean to adjust the threshold. This method is useful for handling images with varying lighting and shadows.
import cv2
import matplotlib.pyplot as plt

image = cv2.imread('McLaren-720S-Price-1200x675.jpg', cv2.IMREAD_GRAYSCALE)

gaussian_adaptive_thresholded_image = cv2.adaptiveThreshold(image, 255, cv2.ADAPTIVE_THRESH_GAUSSIAN_C, cv2.THRESH_BINARY, 11, 2)

plt.subplot(1, 2, 1)
plt.imshow(image, cmap='gray')
plt.title('Original Image')
plt.axis("off")

plt.subplot(1, 2, 2)
plt.imshow(gaussian_adaptive_thresholded_image, cmap='gray')
plt.title('Gaussian Adaptive Thresholded Image')
plt.axis("off")
plt.show()
References
- Encord.com
- Pyimagesearch.com
- OpenCV Thresholding
- OpenCV Filtering
The above is the detailed content of Introduction To Computer Vision with Python (Part 1). For more information, please follow other related articles on the PHP Chinese website!

Hot AI Tools

Undresser.AI Undress
AI-powered app for creating realistic nude photos

AI Clothes Remover
Online AI tool for removing clothes from photos.

Undress AI Tool
Undress images for free

Clothoff.io
AI clothes remover

Video Face Swap
Swap faces in any video effortlessly with our completely free AI face swap tool!

Hot Article
Hot Tools

Notepad++7.3.1
Easy-to-use and free code editor

SublimeText3 Chinese version
Chinese version, very easy to use

Zend Studio 13.0.1
Powerful PHP integrated development environment

Dreamweaver CS6
Visual web development tools

SublimeText3 Mac version
God-level code editing software (SublimeText3)
Hot Topics
 1664
1664
 14
1422
52
1316
25
1268
29
1240
24
14
1422
52
1316
25
1268
29
1240
24

 Python vs. C : Applications and Use Cases Compared
Apr 12, 2025 am 12:01 AM
Python vs. C : Applications and Use Cases Compared
Apr 12, 2025 am 12:01 AM
Python is suitable for data science, web development and automation tasks, while C is suitable for system programming, game development and embedded systems. Python is known for its simplicity and powerful ecosystem, while C is known for its high performance and underlying control capabilities.
 Python: Games, GUIs, and More
Apr 13, 2025 am 12:14 AM
Python: Games, GUIs, and More
Apr 13, 2025 am 12:14 AM
Python excels in gaming and GUI development. 1) Game development uses Pygame, providing drawing, audio and other functions, which are suitable for creating 2D games. 2) GUI development can choose Tkinter or PyQt. Tkinter is simple and easy to use, PyQt has rich functions and is suitable for professional development.
 The 2-Hour Python Plan: A Realistic Approach
Apr 11, 2025 am 12:04 AM
The 2-Hour Python Plan: A Realistic Approach
Apr 11, 2025 am 12:04 AM
You can learn basic programming concepts and skills of Python within 2 hours. 1. Learn variables and data types, 2. Master control flow (conditional statements and loops), 3. Understand the definition and use of functions, 4. Quickly get started with Python programming through simple examples and code snippets.
 Python vs. C : Learning Curves and Ease of Use
Apr 19, 2025 am 12:20 AM
Python vs. C : Learning Curves and Ease of Use
Apr 19, 2025 am 12:20 AM
Python is easier to learn and use, while C is more powerful but complex. 1. Python syntax is concise and suitable for beginners. Dynamic typing and automatic memory management make it easy to use, but may cause runtime errors. 2.C provides low-level control and advanced features, suitable for high-performance applications, but has a high learning threshold and requires manual memory and type safety management.
 How Much Python Can You Learn in 2 Hours?
Apr 09, 2025 pm 04:33 PM
How Much Python Can You Learn in 2 Hours?
Apr 09, 2025 pm 04:33 PM
You can learn the basics of Python within two hours. 1. Learn variables and data types, 2. Master control structures such as if statements and loops, 3. Understand the definition and use of functions. These will help you start writing simple Python programs.
 Python and Time: Making the Most of Your Study Time
Apr 14, 2025 am 12:02 AM
Python and Time: Making the Most of Your Study Time
Apr 14, 2025 am 12:02 AM
To maximize the efficiency of learning Python in a limited time, you can use Python's datetime, time, and schedule modules. 1. The datetime module is used to record and plan learning time. 2. The time module helps to set study and rest time. 3. The schedule module automatically arranges weekly learning tasks.
 Python: Automation, Scripting, and Task Management
Apr 16, 2025 am 12:14 AM
Python: Automation, Scripting, and Task Management
Apr 16, 2025 am 12:14 AM
Python excels in automation, scripting, and task management. 1) Automation: File backup is realized through standard libraries such as os and shutil. 2) Script writing: Use the psutil library to monitor system resources. 3) Task management: Use the schedule library to schedule tasks. Python's ease of use and rich library support makes it the preferred tool in these areas.
 Python: Exploring Its Primary Applications
Apr 10, 2025 am 09:41 AM
Python: Exploring Its Primary Applications
Apr 10, 2025 am 09:41 AM
Python is widely used in the fields of web development, data science, machine learning, automation and scripting. 1) In web development, Django and Flask frameworks simplify the development process. 2) In the fields of data science and machine learning, NumPy, Pandas, Scikit-learn and TensorFlow libraries provide strong support. 3) In terms of automation and scripting, Python is suitable for tasks such as automated testing and system management.
