

Bitcoin Forms Golden Cross On 2-Month Chart, Here's What Happened Last Time

Crypto analyst Titan of Crypto has highlighted a bullish indicator on the Bitcoin chart. The analyst also revealed what happened the last time this pattern formed, suggesting that the leading crypto could enjoy a significant price rally soon enough.
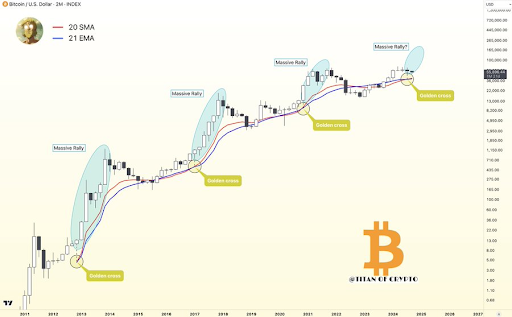
A bullish indicator, known as the Golden Cross, has recently formed on Bitcoin's 2-month chart, as highlighted by crypto analyst Titan of Crypto. The last time this pattern emerged on the 2-month chart, Bitcoin experienced a "massive" rally.
According to the chart shared by the analyst, this occurred in 2021, when Bitcoin rose from around $13,000 to above $60,000.
While the outcome this time remains uncertain, a significant rally is overdue for the leading crypto, given that its price has largely stagnated since reaching a new all-time high (ATH) of $73,000 in March.
In a separate post, Titan of Crypto expressed optimism about a major Bitcoin rally beginning in October. The crypto analyst pointed out how the historically bearish September typically sets the stage for risk assets like Bitcoin and US stocks to experience a strong rebound at the end of the year.
Despite calls suggesting that Bitcoin is now in a downtrend, Titan of Crypto remains bullish on the crypto's outlook. According to the analyst, Bitcoin is still bullish on the monthly timeframe and remains bullish as long as it holds above the Tenkan line at $49,900.
To reach a new ATH in this market cycle, the flagship crypto needs to break above $71,000, based on the chart shared by the analyst. Notably, the crypto analyst had earlier predicted that the flagship crypto could reach a market high of $120,000 by 2025.
Another crypto analyst, Rekt Capital, also expressed a similar sentiment, highlighting that October is the month to watch. According to the analyst, history suggests that Bitcoin should enjoy a breakout from the reaccumulation range in the next two weeks. However, the breakout is more likely to occur in October, adds the analyst.
October tends to be a strong month for the leading crypto, particularly in halving years like this one. A potential Bitcoin rally in October is expected to continue into November and December.
As highlighted by Rekt Capital, the crypto enjoyed three consecutive months of upside in the fourth quarter during the 2016 and 2020 halving years.
At the time of writing, Bitcoin is trading at around $57,700, up over 3% in the last 24 hours, according to data from CoinMarketCap.
The above is the detailed content of Bitcoin Forms Golden Cross On 2-Month Chart, Here's What Happened Last Time. For more information, please follow other related articles on the PHP Chinese website!

Hot AI Tools

Undresser.AI Undress
AI-powered app for creating realistic nude photos

AI Clothes Remover
Online AI tool for removing clothes from photos.

Undress AI Tool
Undress images for free

Clothoff.io
AI clothes remover

Video Face Swap
Swap faces in any video effortlessly with our completely free AI face swap tool!

Hot Article
Hot Tools

Notepad++7.3.1
Easy-to-use and free code editor

SublimeText3 Chinese version
Chinese version, very easy to use

Zend Studio 13.0.1
Powerful PHP integrated development environment

Dreamweaver CS6
Visual web development tools

SublimeText3 Mac version
God-level code editing software (SublimeText3)
Hot Topics
 1662
1662
 14
1419
52
1311
25
1262
29
1234
24
14
1419
52
1311
25
1262
29
1234
24

 Bitcoin (BTC) Exchange Reserves Drop to November 2018 Lows, Raising Liquidity Concerns
Nov 17, 2024 am 09:58 AM
Bitcoin (BTC) Exchange Reserves Drop to November 2018 Lows, Raising Liquidity Concerns
Nov 17, 2024 am 09:58 AM
Bitcoin's (BTC) exchange reserves have dropped to their lowest level since November 2018, reflecting a significant shift in market dynamics.
 Bitcoin (BTC) Poised for a 90% Rally as Puell Multiple Flashes Golden Cross
Nov 20, 2024 am 10:28 AM
Bitcoin (BTC) Poised for a 90% Rally as Puell Multiple Flashes Golden Cross
Nov 20, 2024 am 10:28 AM
Onchain data analytical platform CryptoQuant has flagged a key Bitcoin (BTC) metric that suggests a potential 90% rally for the leading cryptocurrency.
 Solidion Technology Follows MicroStrategy's Playbook, Allocates Bitcoin to Corporate Treasury
Nov 17, 2024 am 03:58 AM
Solidion Technology Follows MicroStrategy's Playbook, Allocates Bitcoin to Corporate Treasury
Nov 17, 2024 am 03:58 AM
Solidion Technology, Inc. (NASDAQ: STI), a leading provider of advanced battery materials, has announced a significant strategic allocation of Bitcoin within its corporate treasury.
 Bitcoin Surpasses $90,000, Shiba Inu Momentum Stalls, Solana Surges
Nov 20, 2024 am 11:21 AM
Bitcoin Surpasses $90,000, Shiba Inu Momentum Stalls, Solana Surges
Nov 20, 2024 am 11:21 AM
In addition to surpassing earlier highs, Bitcoin has reached a critical price level of $92,000, which has strengthened its position in the current bullish cycle.
 Bitcoin (BTC) Set to Outperform Gold (XAU) Even Without US Government Backing, Says Luke Gromen
Nov 20, 2024 am 03:20 AM
Bitcoin (BTC) Set to Outperform Gold (XAU) Even Without US Government Backing, Says Luke Gromen
Nov 20, 2024 am 03:20 AM
Veteran macro investor Luke Gromen believes Bitcoin (BTC) is set to outperform gold even without the backing of the US government.
 Bitcoin's Journey to $1M Relies on Scarcity, Adoption, and Market Dynamics, Not Magic
Nov 19, 2024 pm 09:36 PM
Bitcoin's Journey to $1M Relies on Scarcity, Adoption, and Market Dynamics, Not Magic
Nov 19, 2024 pm 09:36 PM
Bitcoin ETF inflows and treasury adoption push institutional confidence and price growth. Reaching 3% of global wealth could propel Bitcoin's market cap to $20 trillion.
 When Will All Bitcoins Be Mined? Exploring the Finite Supply and Impacts of the Cryptocurrency
Nov 17, 2024 am 01:26 AM
When Will All Bitcoins Be Mined? Exploring the Finite Supply and Impacts of the Cryptocurrency
Nov 17, 2024 am 01:26 AM
Bitcoin has become a household name since its creation in 2009, capturing the attention of investors, technologists, and economists worldwide.
 Could Bitcoin (BTC) Price Hit $100k This Month? Here's What the Charts Say
Nov 19, 2024 am 09:34 AM
Could Bitcoin (BTC) Price Hit $100k This Month? Here's What the Charts Say
Nov 19, 2024 am 09:34 AM
As Bitcoin continues its upward trajectory, analysts are increasingly discussing the possibility of it reaching $100k in November.