

在本文中,我将引导您使用 Python 分析天气模式。从识别温度趋势到可视化降雨量,这本分步指南非常适合任何有兴趣使用数据科学技术进行天气分析的人。我将探索代码、数据操作和可视化以获得实用见解。
在肯尼亚,天气在许多领域发挥着至关重要的作用,特别是农业、旅游业和户外活动。农民、企业和活动策划者需要准确的天气信息才能做出决策。然而,不同地区的天气模式可能存在很大差异,并且当前的预报系统可能并不总是提供本地化的见解。
该项目的目标是从 OpenWeatherMap API 和 Weather API 收集肯尼亚不同地区的实时天气数据。这些数据将存储在数据库中,并使用 Python 进行分析,以揭示以下内容:-
在这个项目中,我分析了包含肯尼亚各个城市天气信息的数据集。该数据集包含 3,000 多行天气观测数据,包括温度、湿度、压力、风速、能见度和降雨量等因素。利用这些见解,我们的目标是提供准确的、针对特定地区的天气预报,以帮助农业、旅游业甚至管理等天气敏感行业的决策。
数据集由多个列构成:
这就是数据库中数据的结构方式。

分析的第一步涉及对数据的基本探索。
_ 数据维度 - 数据集包含 3,000 行和 14 列。
_ Null Values - 最小的缺失数据,确保数据集对于进一步分析是可靠的。
print(df1[['temperature_celsius', 'humidity_pct', 'pressure_hpa', 'wind_speed_ms', 'rain', 'clouds']].describe())
使用上面的代码,我们计算了数字列的汇总统计数据,从而深入了解温度、湿度、压力、降雨量和云的范围、平均值和分布。
为了更清楚地了解天气特征,我们绘制了各种分布:
温度分布
sns.displot(df1['temperature_celsius'], bins=50, kde=True)
plt.title('Temperature Distribution')
plt.xlabel('Temperature (Celsius)')
该分布揭示了各城市温度的总体分布情况。 KDE 线图给出了温度概率分布的平滑估计。
降雨分布
sns.displot(df1['rain'], bins=50, kde=True)
plt.title('Rainfall Distribution')
plt.xlabel('Rainfall (mm/h)')
此代码分析肯尼亚城市的降雨量分布。
湿度、压力和风速
湿度 (%)、压力 (hPa) 和 风速 (m/s) 的类似分布图,每个图都提供了有关这些参数在数据集中的变化。
使用饼图对天气状况(例如“云”、“雨”)进行计数和可视化,以显示其比例分布:
condition_counts = df1['weather_condition'].value_counts()

plt.figure(figsize=(8,8))
plt.pie(condition_counts, labels=condition_counts.index, autopct='%1.1f%%', pctdistance=1.1, labeldistance=0.6, startangle=140)
plt.title('Distribution of Weather Conditions')
plt.axis('equal')
plt.show()

One of the key analysis was the total rainfall by city:
rainfall_by_city = df1.groupby('city')['rain'].sum().sort_values()

plt.figure(figsize=(12,12))
rainfall_by_city.plot(kind='barh', color='skyblue')
plt.title('Total Rainfall by City')
plt.xlabel('Total Rainfall (mm)')
plt.ylabel('City')
plt.tight_layout()
plt.show()
This bar plot highlighted which cities received the most rain over the observed period, with a few outliers showing significant rainfall compared to others.

avg_temp_by_month.plot(kind='line')
plt.title('Average Monthly Temperature')
The line chart revealed temperature fluctuations across different months, showing seasonal changes.

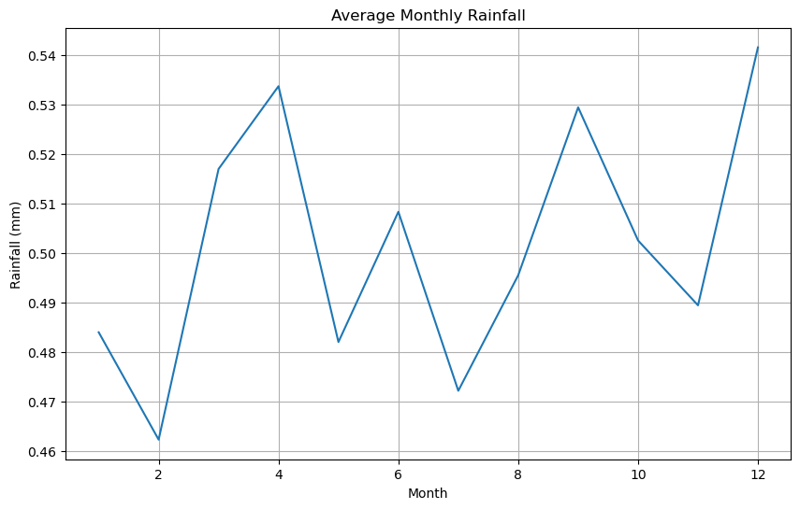
monthly_rain.plot(kind='line')
plt.title('Average Monthly Rainfall')
Similarly, rainfall was analyzed to observe how it varied month-to-month.
We also visualized the data using heatmaps for a more intuitive understanding of monthly temperature and rainfall.
Here are the heatmaps for the average monthly temperature and rainfall


Next, I calculated the correlation matrix between key weather variables:
correlation_matrix = df1[['temperature_celsius', 'humidity_pct', 'pressure_hpa', 'wind_speed_ms', 'rain', 'clouds']].corr()
correlation_matrix
sns.heatmap(correlation_matrix, annot=True, cmap='coolwarm')
plt.title('Correlation Between Weather Variables')
This heatmap allowed us to identify relationships between variables. For example, we observed a negative correlation between temperature and humidity, as expected.
I have focused on individual cities such as Mombasa and Nyeri, to explore their unique weather patterns:
Mombasa Temperature Trends
plt.plot(monthly_avg_temp_msa)
plt.title('Temperature Trends in Mombasa Over Time')
This city showed significant variation in temperature across the year.
Nyeri Rainfall Trends
plt.plot(monthly_avg_rain_nyr)
plt.title('Rainfall Trends in Nyeri Over Time')
The rainfall data for Nyeri displayed a clear seasonal pattern, with rainfall peaking during certain months.
This analysis provides a comprehensive overview of the weather conditions in major cities, highlighting the temperature, rainfall, and other key weather variables. By using visualizations like histograms, line charts, pie charts, and heatmaps, we were able to extract meaningful insights into the data. Further analysis could involve comparing these trends with historical weather patterns or exploring predictive modeling to forecast future weather trends.
You can find the Jupyter Notebook with the full code for this analysis in my GitHub repository).
The above is the detailed content of Comprehensive Weather Data Analysis Using Python: Temperature, Rainfall Trends, and Visualizations. For more information, please follow other related articles on the PHP Chinese website!
 Compare the similarities and differences between two columns of data in excel
 Win10 My Computer Icon Retrieval Tutorial
 sort sorting function usage
 How to install printer driver in linux
 How to unlock android permission restrictions
 excel duplicate item filter color
 what is optimization
 How to repair sql database
 How to use append in python


![[Web front-end] Node.js quick start](https://img.php.cn/upload/course/000/000/067/662b5d34ba7c0227.png)


