

Setting Up MySQL on Kubernetes with Prometheus & Grafana Monitoring

In this tutorial, we'll walk through how to set up MySQL on a Kubernetes (K8s) cluster, along with integrating Prometheus and Grafana for monitoring. We'll use the Bitnami Helm charts for MySQL, Prometheus, and Grafana, and show you how to create a custom Grafana dashboard to monitor MySQL.
1. Create a Namespace for Your Lab
First, create a Kubernetes namespace where you’ll deploy your MySQL and monitoring components.
kubectl create namespace my-lab
To verify the creation of the namespace, run:
kubectl get namespaces
This should list my-lab as one of the namespaces in your cluster.
2. Install MySQL Using Helm
We'll use the Bitnami Helm chart to install MySQL in the my-lab namespace. If you haven't added the Bitnami chart repository yet, do so with the following command:
helm repo add bitnami https://charts.bitnami.com/bitnami
Now, install MySQL with this command:
helm upgrade --install mysql bitnami/mysql --namespace my-lab
To check the status and ensure MySQL is running, use:
kubectl get pods --namespace my-lab
Access the MySQL Pod
To connect to MySQL, first, you’ll need to retrieve the MySQL password from the Kubernetes secrets. Use this command to get the secret:
kubectl get secret -n my-lab
Then decode the mysql-root-password and mysql-password as follows:
kubectl get secret/mysql -oyaml -n my-lab
You can decode the password using base64:
echo <encoded-password> | base64 -d
Now, access the MySQL pod using kubectl exec:
kubectl exec -it mysql-0 --namespace my-lab -- /bin/bash
Once inside the pod, connect to MySQL using the root password:
mysql -u root -p
Enter the decoded root password when prompted.
Create a Database and Some Tables
Once inside MySQL, create a database and some tables to monitor:
create database my_db_1;

use my_db_1;

create table my_table_1 (a varchar(100));
create table my_table_2 (a varchar(100));
create table my_table_3 (a varchar(100));

insert into my_table_1 values('One');
insert into my_table_1 values('One-One');

select * from my_table_1;
3. Install Prometheus and Grafana
Next, we will install Prometheus and Grafana to monitor MySQL.
Install Prometheus and Grafana
First, add the Prometheus community Helm charts:
helm repo add prometheus-community https://prometheus-community.github.io/helm-charts
helm repo update
Create a grafana namespace:
kubectl create ns grafana
Now, install the Prometheus-Grafana stack using Helm:
helm upgrade --install grafana prometheus-community/kube-prometheus-stack --namespace grafana
You can verify the installation by checking the pods:
kubectl get pods -n grafana
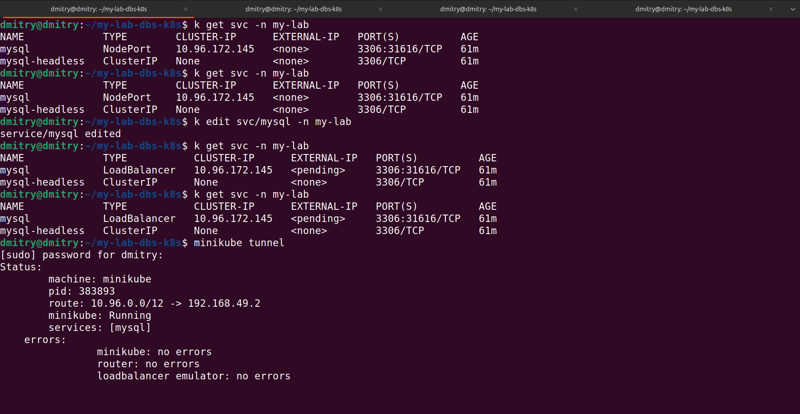
Expose MySQL with LoadBalancer
To access MySQL from outside the Kubernetes cluster, we need to expose the MySQL service using a LoadBalancer. Edit the MySQL service:
kubectl edit svc/mysql -n my-lab
Change the service type from ClusterIP to LoadBalancer:
spec:
  type: LoadBalancer
Verify the external IP has been assigned:
kubectl get svc -n my-lab
If you're using Minikube, you may need to run minikube tunnel to expose the service externally:
minikube tunnel
Now, access MySQL externally using the IP assigned:
kubectl create namespace my-lab
4. Install Prometheus MySQL Exporter
We need to install the MySQL Exporter to collect MySQL metrics and expose them for Prometheus to scrape.
Create Exporter Configuration
Create a file mysql-exporter-values.yaml with your MySQL connection details:
kubectl get namespaces
Now, install the MySQL exporter using Helm:
helm repo add bitnami https://charts.bitnami.com/bitnami
Port-Forward Prometheus MySQL Exporter
To forward the MySQL exporter metrics to your local machine for testing, use:
helm upgrade --install mysql bitnami/mysql --namespace my-lab
Verify the metrics are being exposed by visiting http://localhost:9104/metrics.

5. Connect Grafana to Prometheus
Now that Prometheus and the MySQL exporter are set up, let’s connect Grafana to Prometheus.
Port-Forward Grafana
To access the Grafana dashboard, run the following port-forward command:
kubectl get pods --namespace my-lab
This will make Grafana accessible at http://localhost:3000. The default login credentials are:
Username: admin
Password: prom-operator

Once logged in, add Prometheus as a data source in Grafana:
Go to Configuration > Data Sources.
Add Prometheus as a data source with the URL http://prometheus-operated:9090.
6. Import Grafana Dashboards
To monitor MySQL, we can import pre-configured dashboards from Grafana's dashboard repository.
Import Dashboards
Go to Dashboards > Import and enter the following dashboard IDs:
Dashboard ID 14057 (MySQL Overview)
Dashboard ID 7362 (MySQL Performance)
These dashboards will automatically load and show relevant MySQL metrics, such as connections, queries, and resource utilization.

7. Conclusion
You've successfully set up MySQL in Kubernetes and integrated Prometheus and Grafana for monitoring. You can now monitor your MySQL instance in real-time using Grafana dashboards.
Key Takeaways:
- MySQL is running on Kubernetes using the Bitnami Helm chart.
- Prometheus is used to scrape metrics from MySQL using the MySQL exporter.
- Grafana is configured to visualize the data collected by Prometheus.
- You can access MySQL externally using a LoadBalancer service.
With this setup, you can easily scale and monitor your database infrastructure on Kubernetes.
The above is the detailed content of Setting Up MySQL on Kubernetes with Prometheus & Grafana Monitoring. For more information, please follow other related articles on the PHP Chinese website!

Hot AI Tools

Undresser.AI Undress
AI-powered app for creating realistic nude photos

AI Clothes Remover
Online AI tool for removing clothes from photos.

Undress AI Tool
Undress images for free

Clothoff.io
AI clothes remover

AI Hentai Generator
Generate AI Hentai for free.

Hot Article
Hot Tools

Notepad++7.3.1
Easy-to-use and free code editor

SublimeText3 Chinese version
Chinese version, very easy to use

Zend Studio 13.0.1
Powerful PHP integrated development environment

Dreamweaver CS6
Visual web development tools

SublimeText3 Mac version
God-level code editing software (SublimeText3)
Hot Topics
 1384
1384
 52
52

 Explain InnoDB Full-Text Search capabilities.
Apr 02, 2025 pm 06:09 PM
Explain InnoDB Full-Text Search capabilities.
Apr 02, 2025 pm 06:09 PM
InnoDB's full-text search capabilities are very powerful, which can significantly improve database query efficiency and ability to process large amounts of text data. 1) InnoDB implements full-text search through inverted indexing, supporting basic and advanced search queries. 2) Use MATCH and AGAINST keywords to search, support Boolean mode and phrase search. 3) Optimization methods include using word segmentation technology, periodic rebuilding of indexes and adjusting cache size to improve performance and accuracy.
 How do you alter a table in MySQL using the ALTER TABLE statement?
Mar 19, 2025 pm 03:51 PM
How do you alter a table in MySQL using the ALTER TABLE statement?
Mar 19, 2025 pm 03:51 PM
The article discusses using MySQL's ALTER TABLE statement to modify tables, including adding/dropping columns, renaming tables/columns, and changing column data types.
 When might a full table scan be faster than using an index in MySQL?
Apr 09, 2025 am 12:05 AM
When might a full table scan be faster than using an index in MySQL?
Apr 09, 2025 am 12:05 AM
Full table scanning may be faster in MySQL than using indexes. Specific cases include: 1) the data volume is small; 2) when the query returns a large amount of data; 3) when the index column is not highly selective; 4) when the complex query. By analyzing query plans, optimizing indexes, avoiding over-index and regularly maintaining tables, you can make the best choices in practical applications.
 Can I install mysql on Windows 7
Apr 08, 2025 pm 03:21 PM
Can I install mysql on Windows 7
Apr 08, 2025 pm 03:21 PM
Yes, MySQL can be installed on Windows 7, and although Microsoft has stopped supporting Windows 7, MySQL is still compatible with it. However, the following points should be noted during the installation process: Download the MySQL installer for Windows. Select the appropriate version of MySQL (community or enterprise). Select the appropriate installation directory and character set during the installation process. Set the root user password and keep it properly. Connect to the database for testing. Note the compatibility and security issues on Windows 7, and it is recommended to upgrade to a supported operating system.
 How do I configure SSL/TLS encryption for MySQL connections?
Mar 18, 2025 pm 12:01 PM
How do I configure SSL/TLS encryption for MySQL connections?
Mar 18, 2025 pm 12:01 PM
Article discusses configuring SSL/TLS encryption for MySQL, including certificate generation and verification. Main issue is using self-signed certificates' security implications.[Character count: 159]
 Difference between clustered index and non-clustered index (secondary index) in InnoDB.
Apr 02, 2025 pm 06:25 PM
Difference between clustered index and non-clustered index (secondary index) in InnoDB.
Apr 02, 2025 pm 06:25 PM
The difference between clustered index and non-clustered index is: 1. Clustered index stores data rows in the index structure, which is suitable for querying by primary key and range. 2. The non-clustered index stores index key values and pointers to data rows, and is suitable for non-primary key column queries.
 What are some popular MySQL GUI tools (e.g., MySQL Workbench, phpMyAdmin)?
Mar 21, 2025 pm 06:28 PM
What are some popular MySQL GUI tools (e.g., MySQL Workbench, phpMyAdmin)?
Mar 21, 2025 pm 06:28 PM
Article discusses popular MySQL GUI tools like MySQL Workbench and phpMyAdmin, comparing their features and suitability for beginners and advanced users.[159 characters]
 How do you handle large datasets in MySQL?
Mar 21, 2025 pm 12:15 PM
How do you handle large datasets in MySQL?
Mar 21, 2025 pm 12:15 PM
Article discusses strategies for handling large datasets in MySQL, including partitioning, sharding, indexing, and query optimization.
