

TanStack Table Explained: Everything You Need to Know

Introduction
In the world of modern web development, displaying data effectively and efficiently is a common challenge. Whether it's a simple list of users or a complex financial report, tables are essential. While there are many libraries available to handle tables in React, few offer the flexibility, performance, and ease of use that TanStack Table does.
TanStack Table, previously known as React Table, has quickly become the go-to solution for developers needing powerful and customizable table components. TanStack is not only compatible with React but it also supports Angular, Lit, Qwik, Solid, Svelte, Vue, and also Vanilla JavaScript/TypeScript.
In this blog post, we'll dive into what makes TanStack Table stand out, explore its core features, and provide a hands-on example to get you started.
What is TanStack Table?
TanStack Table is a lightweight, highly customizable, and headless UI for building powerful tables & data grids. By "headless," we mean it comes with all the core functionality and logic for table operations without any user interface. This gives us total control over our table's appearance while also taking advantage of the built-in functionality.
Why choose the TanStack table?
Choosing a table library for your project can be confusing as so many options are available online. Here’s why TanStack Table might be the best fit for your next project:
1. Performance
When our dataset is large managing it efficiently becomes crucial as we also have to take performance into account. TanStack uses features like Virtualization and Tree shaking which are methods for optimising performance. It also optimizes rendering to ensure that even if there are tens of thousands of rows the performance is smooth.
Tree shaking is a process of optimising during final javascript bundling, it removes all the dead code or unused code from the bundle.
Virtualization or Windowing is a technique to improve performance by only rendering the items that are currently in view.
2. Adaptability
TanStack table supports headless architecture which allows us to be free from any built-in UI. Its high customizability lets us integrate it with any CSS framework or theme. This flexibility comes in very handy when design changes are required for almost every project.
3. Advanced Feature
TanStack Table supports a wide range of feature lists such as:
Sorting with customizable sort functions.
Built-in filters or custom filter logic.
Hide or unhide any column.
Built-in pagination logic.
Group rows by any criteria.
Dynamic resizing of columns.
Select rows with checkboxes or other UI elements.
4. Active Community and Support
TanStack Table is actively maintained and is supported by a great community. The documentation is precise and easy to understand.
Key challenges when using TanStack Table
Although TanStack Table offers many advantages, it also has some drawbacks.
Managing column width according to data length.
Making the table responsive for all screen sizes.
Debugging a custom build table using the TanStack table
Comprehensive documents can make it difficult to find quick answers.
The learning curve is steep.
Getting Started with TanStack Table
Let's start with a simple example. We'll create a basic table using TanStack Table.
Step 1: Install TanStack Table
First, let's install TanStack Table and its peer dependencies.
npm install @tanstack/react-table
Step 2: Set Up the Table
We'll start by setting up our table component. For this example, we’ll use a simple dataset of users.
import * as React from 'react';
import {
  createColumnHelper,
  flexRender,
  getCoreRowModel,
  useReactTable,
} from '@tanstack/react-table';

export type User = {
  id: number;
  name: string;
  age: number;
  email: string;
  country: string;
  subscription: string;
  wallet_balance: number;
};

export const users: User[] = [
  {
    id: 1,
    name: 'John Doe',
    age: 35,
    email: 'john.doe@example.com',
    country: 'United States',
    subscription: 'Premium',
    wallet_balance: 150.25,
  },
  {
    id: 2,
    name: 'Alice Smith',
    age: 28,
    email: 'alice.smith@example.com',
    country: 'Canada',
    subscription: 'Basic',
    wallet_balance: 50.75,
  }
];

const columnHelper = createColumnHelper<User>();

const columns = [
  columnHelper.accessor('name', {
    header: () => 'Name',
    cell: (info) => info.getValue(),
  }),
  columnHelper.accessor('age', {
    header: () => 'Age',
    cell: (info) => info.getValue(),
  }),
  columnHelper.accessor('email', {
    header: () => 'Email',
    cell: (info) => info.getValue(),
  }),
  columnHelper.accessor('country', {
    header: () => 'Country',
  }),
  columnHelper.accessor('subscription', {
    header: 'Subscription',
  }),
  columnHelper.accessor('wallet_balance', {
    header: 'Wallet balance',
  }),
];

const Table = () => {
  const [data, _setData] = React.useState([...users]);

  const table = useReactTable({
    data,
    columns,
    getCoreRowModel: getCoreRowModel(),
  });

  return (
      <table>
        <thead>
          {table.getHeaderGroups().map((headerGroup) => (
            <tr key={headerGroup.id}>
              {headerGroup.headers.map((header) => (
                <th
                  key={header.id}
                >
                  {header.isPlaceholder
                    ? null
                    : flexRender(
                        header.column.columnDef.header,
                        header.getContext()
                      )}
                </th>
              ))}
            </tr>
          ))}
        </thead>
        <tbody>
          {table.getRowModel().rows.map((row) => (
            <tr key={row.id}>
              {row.getVisibleCells().map((cell) => (
                <td key={cell.id}>
                  {flexRender(cell.column.columnDef.cell, cell.getContext())}
                </td>
              ))}
            </tr>
          ))}
        </tbody>
      </table>
  );
};

export default Table;
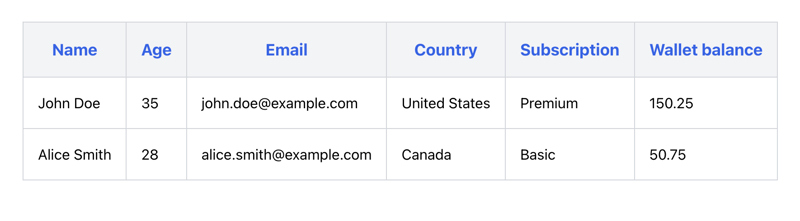
In the code above we have users data to populate the table. We are using createColumnHelper function to create columnHelper which is then used to define an array of columns. These columns decide how data will appear in the table. It creates columns according to the header we have provided. In this case, it is "Name," "Age," "Email," etc. We can customize cell rendering behavior by providing cell property. If it is not provided then it indicates that the default cell rendering behavior will be used.
useReactTable hook is used to set up a table component with data and column configurations. This configuration decides how data will be rendered in the table. We are using table.getHeaderGroups() and table.getRowModel().rows for generating the header and body of the table.
After some styling, the table would look like the below image:
Step 3: Customize accordingly
You can now start customizing the table according to your needs. You can add search, sorting, pagination, or any other features. TanStack provides the hooks and ease to add all this functionality. You can refer to their official documentation here.
Conclusion
TanStack's table could be a great option for your next table. Its headless UI makes design integration effortless and its rich feature set makes it simple to create pagination, sorting, filtering, and other features. For further clarity, explore additional examples in the documentation.
Happy coding!
Resources
- TanStack Table Documentation
We at CreoWis believe in sharing knowledge publicly to help the developer community grow. Let’s collaborate, ideate, and craft passion to deliver awe-inspiring product experiences.
Let's connect:
X/Twitter
LinkedIn
Website
This article is crafted by Prachi Sahu, a passionate developer at CreoWis. You can reach out to her on X/Twitter, LinkedIn, and follow her work on the GitHub.
The above is the detailed content of TanStack Table Explained: Everything You Need to Know. For more information, please follow other related articles on the PHP Chinese website!

Hot AI Tools

Undresser.AI Undress
AI-powered app for creating realistic nude photos

AI Clothes Remover
Online AI tool for removing clothes from photos.

Undress AI Tool
Undress images for free

Clothoff.io
AI clothes remover

AI Hentai Generator
Generate AI Hentai for free.

Hot Article
Hot Tools

Notepad++7.3.1
Easy-to-use and free code editor

SublimeText3 Chinese version
Chinese version, very easy to use

Zend Studio 13.0.1
Powerful PHP integrated development environment

Dreamweaver CS6
Visual web development tools

SublimeText3 Mac version
God-level code editing software (SublimeText3)
Hot Topics
 1377
1377
 52
52

 How do I create and publish my own JavaScript libraries?
Mar 18, 2025 pm 03:12 PM
How do I create and publish my own JavaScript libraries?
Mar 18, 2025 pm 03:12 PM
Article discusses creating, publishing, and maintaining JavaScript libraries, focusing on planning, development, testing, documentation, and promotion strategies.
 How do I optimize JavaScript code for performance in the browser?
Mar 18, 2025 pm 03:14 PM
How do I optimize JavaScript code for performance in the browser?
Mar 18, 2025 pm 03:14 PM
The article discusses strategies for optimizing JavaScript performance in browsers, focusing on reducing execution time and minimizing impact on page load speed.
 What should I do if I encounter garbled code printing for front-end thermal paper receipts?
Apr 04, 2025 pm 02:42 PM
What should I do if I encounter garbled code printing for front-end thermal paper receipts?
Apr 04, 2025 pm 02:42 PM
Frequently Asked Questions and Solutions for Front-end Thermal Paper Ticket Printing In Front-end Development, Ticket Printing is a common requirement. However, many developers are implementing...
 How do I debug JavaScript code effectively using browser developer tools?
Mar 18, 2025 pm 03:16 PM
How do I debug JavaScript code effectively using browser developer tools?
Mar 18, 2025 pm 03:16 PM
The article discusses effective JavaScript debugging using browser developer tools, focusing on setting breakpoints, using the console, and analyzing performance.
 How do I use Java's collections framework effectively?
Mar 13, 2025 pm 12:28 PM
How do I use Java's collections framework effectively?
Mar 13, 2025 pm 12:28 PM
This article explores effective use of Java's Collections Framework. It emphasizes choosing appropriate collections (List, Set, Map, Queue) based on data structure, performance needs, and thread safety. Optimizing collection usage through efficient
 How do I use source maps to debug minified JavaScript code?
Mar 18, 2025 pm 03:17 PM
How do I use source maps to debug minified JavaScript code?
Mar 18, 2025 pm 03:17 PM
The article explains how to use source maps to debug minified JavaScript by mapping it back to the original code. It discusses enabling source maps, setting breakpoints, and using tools like Chrome DevTools and Webpack.
 Getting Started With Chart.js: Pie, Doughnut, and Bubble Charts
Mar 15, 2025 am 09:19 AM
Getting Started With Chart.js: Pie, Doughnut, and Bubble Charts
Mar 15, 2025 am 09:19 AM
This tutorial will explain how to create pie, ring, and bubble charts using Chart.js. Previously, we have learned four chart types of Chart.js: line chart and bar chart (tutorial 2), as well as radar chart and polar region chart (tutorial 3). Create pie and ring charts Pie charts and ring charts are ideal for showing the proportions of a whole that is divided into different parts. For example, a pie chart can be used to show the percentage of male lions, female lions and young lions in a safari, or the percentage of votes that different candidates receive in the election. Pie charts are only suitable for comparing single parameters or datasets. It should be noted that the pie chart cannot draw entities with zero value because the angle of the fan in the pie chart depends on the numerical size of the data point. This means any entity with zero proportion
 TypeScript for Beginners, Part 2: Basic Data Types
Mar 19, 2025 am 09:10 AM
TypeScript for Beginners, Part 2: Basic Data Types
Mar 19, 2025 am 09:10 AM
Once you have mastered the entry-level TypeScript tutorial, you should be able to write your own code in an IDE that supports TypeScript and compile it into JavaScript. This tutorial will dive into various data types in TypeScript. JavaScript has seven data types: Null, Undefined, Boolean, Number, String, Symbol (introduced by ES6) and Object. TypeScript defines more types on this basis, and this tutorial will cover all of them in detail. Null data type Like JavaScript, null in TypeScript
