

Mastering Golang Debugging in Emacs

Introduction
Since I've started developing in Golang I didn't really use the debugger. Instead I was naively adding fmt.Print statements everywhere to validate my code ?. While print statements and logs might be also your first debugging instinct, they often fall short when dealing with large and complex code base, with sophisticated runtime behaviour and (of course!) complex concurrency issues that seem impossible to reproduce.
After starting working on more complex projects (like this one: https://github.com/cloudoperators/heureka) I had to force myself to have a deeper look at delve (the Golang debugger) and see what Emacs offers for interacting with it. While the Go ecosystem offers excellent debugging tools, integrating them into a comfortable development workflow can be challenging.
In this post I'll elaborate the powerful combination of Emacs, Delve, and dape. Together, these tools create a debugging experience that mimics (and often surpasses) traditional IDEs, while preserving the flexibility and extensibility that Emacs is famous for.
This is what you can expect:
- Set up and configure Delve with dape
- Debug both standard applications and Ginkgo tests (this is what I'm using at the moment ?)
- Optimize your debugging workflow with Emacs specific customizations
Setting Up the Development Environment
In this post I assume you already have some Emacs experience and now how to configure packages and write small Elisp snippets. I personally use straight.el as a package manager, minimal-emacs.d as a minimal vanilla Emacs configuration (along with my own custommizations), dape as the debug adapter client and eglot as my LSP client.
Required Emacs Packages
For Emacs 29 users, eglot is built-in. Check out configuring eglot for gopls and some more advanced gopls settings. We'll first add dape:
(use-package dape
  :straight t
  :config
  ;; Pulse source line (performance hit)
  (add-hook 'dape-display-source-hook 'pulse-momentary-highlight-one-line)

  ;; To not display info and/or buffers on startup
  ;; (remove-hook 'dape-start-hook 'dape-info)
  (remove-hook 'dape-start-hook 'dape-repl))
And go-mode:
(use-package go-mode
  :straight t
  :mode "\.go\'"
  :hook ((before-save . gofmt-before-save))
  :bind (:map go-mode-map
              ("M-?" . godoc-at-point)
              ("M-." . xref-find-definitions)
              ("M-_" . xref-find-references)
              ;; ("M-*" . pop-tag-mark) ;; Jump back after godef-jump
              ("C-c m r" . go-run))
  :custom
  (gofmt-command "goimports"))
Installing Required Go Tools
Install Delve and gopls, the LSP server:
# Install Delve
go install github.com/go-delve/delve/cmd/dlv@latest

# Install gopls
go install golang.org/x/tools/gopls@latest
Additionally I have a bunch of other tools which I use from time to time:
go install github.com/golangci/golangci-lint/cmd/golangci-lint@latest
go install github.com/onsi/ginkgo/v2/ginkgo@latest

go install -v golang.org/x/tools/cmd/godoc@latest
go install -v golang.org/x/tools/cmd/goimports@latest
go install -v github.com/stamblerre/gocode@latest
go install -v golang.org/x/tools/cmd/gorename@latest
go install -v golang.org/x/tools/cmd/guru@latest
go install -v github.com/cweill/gotests/...@latest

go install -v github.com/davidrjenni/reftools/cmd/fillstruct@latest
go install -v github.com/fatih/gomodifytags@latest
go install -v github.com/godoctor/godoctor@latest
go install -v github.com/haya14busa/gopkgs/cmd/gopkgs@latest
go install -v github.com/josharian/impl@latest
go install -v github.com/rogpeppe/godef@latest
Then you need to configure the corresponding Emacs packages:
(use-package ginkgo
  :straight (:type git :host github :repo "garslo/ginkgo-mode")
  :init
  (setq ginkgo-use-pwd-as-test-dir t
        ginkgo-use-default-keys t))

(use-package gotest
  :straight t
  :after go-mode
  :bind (:map go-mode-map
              ("C-c t f" . go-test-current-file)
              ("C-c t t" . go-test-current-test)
              ("C-c t j" . go-test-current-project)
              ("C-c t b" . go-test-current-benchmark)
              ("C-c t c" . go-test-current-coverage)
              ("C-c t x" . go-run)))

(use-package go-guru
  :straight t
  :hook
  (go-mode . go-guru-hl-identifier-mode))

(use-package go-projectile
  :straight t
  :after (projectile go-mode))

(use-package flycheck-golangci-lint
  :straight t
  :hook
  (go-mode . flycheck-golangci-lint-setup))

(use-package go-eldoc
  :straight t
  :hook
  (go-mode . go-eldoc-setup))

(use-package go-tag
  :straight t
  :bind (:map go-mode-map
              ("C-c t a" . go-tag-add)
              ("C-c t r" . go-tag-remove))
  :init (setq go-tag-args (list "-transform" "camelcase")))

(use-package go-fill-struct
  :straight t)

(use-package go-impl
  :straight t)

(use-package go-playground
  :straight t)
Dape Configuration
There is no particular reason why I use dape instead of dap. When I was still using MinEmacs it was part of it and I just got used to it. As the documentation states:
- Dape does not support launch.json files, if per project configuration is needed use dir-locals and dape-command.
- Dape enhances ergonomics within the minibuffer by allowing users to modify or add PLIST entries to an existing configuration using options.
- No magic, no special variables like ${workspaceFolder}. Instead, functions and variables are resolved before starting a new session.
- Tries to envision how debug adapter configurations would be implemented in Emacs if vscode never existed.
If you ever worked with VSCode you already know that it uses a launch.json to store different debugging profiles:
(use-package dape
  :straight t
  :config
  ;; Pulse source line (performance hit)
  (add-hook 'dape-display-source-hook 'pulse-momentary-highlight-one-line)

  ;; To not display info and/or buffers on startup
  ;; (remove-hook 'dape-start-hook 'dape-info)
  (remove-hook 'dape-start-hook 'dape-repl))
You have different fields/properties which according to this page you can tweak in your debugging configuration:
| Property | Description |
|---|---|
| name | Name for your configuration that appears in the drop down in the Debug viewlet |
| type | Always set to "go". This is used by VS Code to figure out which extension should be used for debugging your code |
| request | Either of launch or attach. Use attach when you want to attach to an already running process |
| mode | For launch requests, either of auto, debug, remote, test, exec. For attach requests, use either local or remote |
| program | Absolute path to the package or file to debug when in debug & test mode, or to the pre-built binary file to debug in exec mode |
| env | Environment variables to use when debugging. Example: { "ENVNAME": "ENVVALUE" } |
| envFile | Absolute path to a file containing environment variable definitions |
| args | Array of command line arguments that will be passed to the program being debugged |
| showLog | Boolean indicating if logs from delve should be printed in the debug console |
| logOutput | Comma separated list of delve components for debug output |
| buildFlags | Build flags to be passed to the Go compiler |
| remotePath | Absolute path to the file being debugged on the remote machine |
| processId | ID of the process that needs debugging (for attach request with local mode) |
Sample Application
Now let's put our knowledge into practice by debugging a real application implementing a REST API.
Project Structure
Our example is a REST API for task management with the following structure:
(use-package dape
  :straight t
  :config
  ;; Pulse source line (performance hit)
  (add-hook 'dape-display-source-hook 'pulse-momentary-highlight-one-line)

  ;; To not display info and/or buffers on startup
  ;; (remove-hook 'dape-start-hook 'dape-info)
  (remove-hook 'dape-start-hook 'dape-repl))
Core Components
Let's have a look at the core components.
The Task represents our core domain model:
(use-package go-mode
  :straight t
  :mode "\.go\'"
  :hook ((before-save . gofmt-before-save))
  :bind (:map go-mode-map
              ("M-?" . godoc-at-point)
              ("M-." . xref-find-definitions)
              ("M-_" . xref-find-references)
              ;; ("M-*" . pop-tag-mark) ;; Jump back after godef-jump
              ("C-c m r" . go-run))
  :custom
  (gofmt-command "goimports"))
The TaskStore handles our in-memory data operations:
# Install Delve
go install github.com/go-delve/delve/cmd/dlv@latest

# Install gopls
go install golang.org/x/tools/gopls@latest
REST API
The API exposes following endpoints:
- POST /task/create - Creates a new task
-
GET /task/get?id=
- Retrieves a task by ID
go install github.com/golangci/golangci-lint/cmd/golangci-lint@latest
go install github.com/onsi/ginkgo/v2/ginkgo@latest

go install -v golang.org/x/tools/cmd/godoc@latest
go install -v golang.org/x/tools/cmd/goimports@latest
go install -v github.com/stamblerre/gocode@latest
go install -v golang.org/x/tools/cmd/gorename@latest
go install -v golang.org/x/tools/cmd/guru@latest
go install -v github.com/cweill/gotests/...@latest

go install -v github.com/davidrjenni/reftools/cmd/fillstruct@latest
go install -v github.com/fatih/gomodifytags@latest
go install -v github.com/godoctor/godoctor@latest
go install -v github.com/haya14busa/gopkgs/cmd/gopkgs@latest
go install -v github.com/josharian/impl@latest
go install -v github.com/rogpeppe/godef@latest
Server
Here's the server implementation:
(use-package ginkgo
  :straight (:type git :host github :repo "garslo/ginkgo-mode")
  :init
  (setq ginkgo-use-pwd-as-test-dir t
        ginkgo-use-default-keys t))

(use-package gotest
  :straight t
  :after go-mode
  :bind (:map go-mode-map
              ("C-c t f" . go-test-current-file)
              ("C-c t t" . go-test-current-test)
              ("C-c t j" . go-test-current-project)
              ("C-c t b" . go-test-current-benchmark)
              ("C-c t c" . go-test-current-coverage)
              ("C-c t x" . go-run)))

(use-package go-guru
  :straight t
  :hook
  (go-mode . go-guru-hl-identifier-mode))

(use-package go-projectile
  :straight t
  :after (projectile go-mode))

(use-package flycheck-golangci-lint
  :straight t
  :hook
  (go-mode . flycheck-golangci-lint-setup))

(use-package go-eldoc
  :straight t
  :hook
  (go-mode . go-eldoc-setup))

(use-package go-tag
  :straight t
  :bind (:map go-mode-map
              ("C-c t a" . go-tag-add)
              ("C-c t r" . go-tag-remove))
  :init (setq go-tag-args (list "-transform" "camelcase")))

(use-package go-fill-struct
  :straight t)

(use-package go-impl
  :straight t)

(use-package go-playground
  :straight t)
Let's look at our main function:
{
    "name": "Launch file",
    "type": "go",
    "request": "launch",
    "mode": "auto",
    "program": "${file}"
}
Build application
Let's start the server:
taskapi/
├── go.mod
├── go.sum
├── main.go
├── task_store.go
└── task_test.go
Now from a different terminal create a new task:
import (
    "fmt"
)

type Task struct {
    ID          int    `json:"id"`
    Title       string `json:"title"`
    Description string `json:"description"`
    Done        bool   `json:"done"`
}
Response:
type TaskStore struct {
    tasks  map[int]Task
    nextID int
}

func NewTaskStore() *TaskStore {
    return &TaskStore{
        tasks:  make(map[int]Task),
        nextID: 1,
    }
}
Let's see if we can fetch it:
// CreateTask stores a given Task internally
func (ts *TaskStore) CreateTask(task Task) Task {
    task.ID = ts.nextID
    ts.tasks[task.ID] = task
    ts.nextID++
    return task
}

// GetTask retrieves a Task by ID
func (ts *TaskStore) GetTask(id int) (Task, error) {
    task, exists := ts.tasks[id]
    if !exists {
        return Task{}, fmt.Errorf("task with id %d not found", id)
    }
    return task, nil
}

// UpdateTask updates task ID with a new Task object
func (ts *TaskStore) UpdateTask(id int, task Task) error {
    if _, exists := ts.tasks[id]; !exists {
        return fmt.Errorf("task with id %d not found", id)
    }
    task.ID = id
    ts.tasks[id] = task
    return nil
}
Response:
package main

import (
    "encoding/json"
    "fmt"
    "net/http"
)

// Server implements a web application for managing tasks
type Server struct {
    store *TaskStore
}

func (s *Server) handleCreateTask(w http.ResponseWriter, r *http.Request) {
    if r.Method != http.MethodPost {
        http.Error(w, "Method not allowed", http.StatusMethodNotAllowed)
        return
    }
    var task Task
    if err := json.NewDecoder(r.Body).Decode(&task); err != nil {
        http.Error(w, err.Error(), http.StatusBadRequest)
        return
    }

    createdTask := s.store.CreateTask(task)
    w.Header().Set("Content-Type", "application/json")
    json.NewEncoder(w).Encode(createdTask)
}

func (s *Server) handleGetTask(w http.ResponseWriter, r *http.Request) {
    if r.Method != http.MethodGet {
        http.Error(w, "Method not allowed", http.StatusMethodNotAllowed)
        return
    }
    id := 0
    fmt.Sscanf(r.URL.Query().Get("id"), "%d", &id)

    task, err := s.store.GetTask(id)
    if err != nil {
        http.Error(w, err.Error(), http.StatusNotFound)
        return
    }

    w.Header().Set("Content-Type", "application/json")
    json.NewEncoder(w).Encode(task)
}
Unit tests
Below are some unit tests (written in Ginkgo) for the TaskStore:
package main

import (
    "log"
    "net/http"
)

func main() {
    store := NewTaskStore()
    server := &Server{store: store}
    http.HandleFunc("/task/create", server.handleCreateTask)
    http.HandleFunc("/task/get", server.handleGetTask)

    log.Printf("Starting server on :8080")
    log.Fatal(http.ListenAndServe(":8080", nil))
}
go build -o taskapi *.go
./taskapi
2024/11/14 07:03:48 Starting server on :8080
In Emacs I would then call ginkgo-run-this-container as shown in this screenshot:

Basic Debugging with Delve and Dape
In order to debug our Task API we have following approaches:
- we can launch the application directly and debug it
- we can attach to a running process
- we can attach to a running debugging session
Here are the options for different request types:
| request | mode | required | optional | ||||||||||||||||||||||||||||||||
|---|---|---|---|---|---|---|---|---|---|---|---|---|---|---|---|---|---|---|---|---|---|---|---|---|---|---|---|---|---|---|---|---|---|---|---|
|
debug | program | dlvCwd, env, backend, args, cwd, buildFlags, output, noDebug | ||||||||||||||||||||||||||||||||
| test | program | dlvCwd, env, backend, args, cwd, buildFlags, output, noDebug | |||||||||||||||||||||||||||||||||
| exec | program | dlvCwd, env, backend, args, cwd, noDebug | |||||||||||||||||||||||||||||||||
| core | program, corefilePath | dlvCwd, env | |||||||||||||||||||||||||||||||||
| replay | traceDirPath | dlvCwd, env | |||||||||||||||||||||||||||||||||
| attach | local | processId | backend | ||||||||||||||||||||||||||||||||
| remote |
Profile 1: Launch application
Here's our first debugging profile for .dir-locals.el:
(use-package dape
  :straight t
  :config
  ;; Pulse source line (performance hit)
  (add-hook 'dape-display-source-hook 'pulse-momentary-highlight-one-line)

  ;; To not display info and/or buffers on startup
  ;; (remove-hook 'dape-start-hook 'dape-info)
  (remove-hook 'dape-start-hook 'dape-repl))
? You may want to use a different value for command-cwd. In my case I wanted to start the debugger in a directory which currently is not a project. default-directory is a variable which holds the working directory for the current buffer you're currently in.
Start debugging:
- Run dape-info to show debugging information
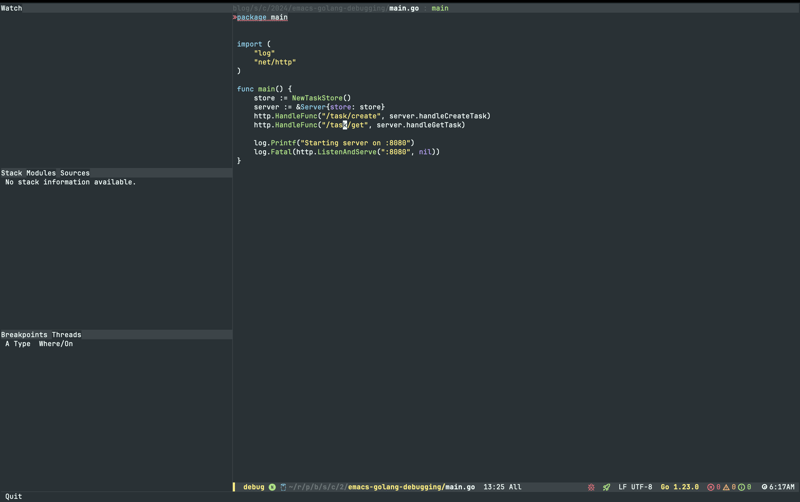
- Create breakpoint using dape-breakpoint-toggle:

After starting the debugger with this profile, you should see in the dape-repl buffer:
(use-package go-mode
  :straight t
  :mode "\.go\'"
  :hook ((before-save . gofmt-before-save))
  :bind (:map go-mode-map
              ("M-?" . godoc-at-point)
              ("M-." . xref-find-definitions)
              ("M-_" . xref-find-references)
              ;; ("M-*" . pop-tag-mark) ;; Jump back after godef-jump
              ("C-c m r" . go-run))
  :custom
  (gofmt-command "goimports"))
Note that we didn't specify any binary/file to debug (we had :program "." in .dir-locals.el). delve will automatically build the binary before it launches the application:
# Install Delve
go install github.com/go-delve/delve/cmd/dlv@latest

# Install gopls
go install golang.org/x/tools/gopls@latest
Profile 2: Attach to an external debugger
Let's add a profile for connecting to an existing debugging session:
go install github.com/golangci/golangci-lint/cmd/golangci-lint@latest
go install github.com/onsi/ginkgo/v2/ginkgo@latest

go install -v golang.org/x/tools/cmd/godoc@latest
go install -v golang.org/x/tools/cmd/goimports@latest
go install -v github.com/stamblerre/gocode@latest
go install -v golang.org/x/tools/cmd/gorename@latest
go install -v golang.org/x/tools/cmd/guru@latest
go install -v github.com/cweill/gotests/...@latest

go install -v github.com/davidrjenni/reftools/cmd/fillstruct@latest
go install -v github.com/fatih/gomodifytags@latest
go install -v github.com/godoctor/godoctor@latest
go install -v github.com/haya14busa/gopkgs/cmd/gopkgs@latest
go install -v github.com/josharian/impl@latest
go install -v github.com/rogpeppe/godef@latest
Now let's start the debugger on the CLI:
(use-package ginkgo
  :straight (:type git :host github :repo "garslo/ginkgo-mode")
  :init
  (setq ginkgo-use-pwd-as-test-dir t
        ginkgo-use-default-keys t))

(use-package gotest
  :straight t
  :after go-mode
  :bind (:map go-mode-map
              ("C-c t f" . go-test-current-file)
              ("C-c t t" . go-test-current-test)
              ("C-c t j" . go-test-current-project)
              ("C-c t b" . go-test-current-benchmark)
              ("C-c t c" . go-test-current-coverage)
              ("C-c t x" . go-run)))

(use-package go-guru
  :straight t
  :hook
  (go-mode . go-guru-hl-identifier-mode))

(use-package go-projectile
  :straight t
  :after (projectile go-mode))

(use-package flycheck-golangci-lint
  :straight t
  :hook
  (go-mode . flycheck-golangci-lint-setup))

(use-package go-eldoc
  :straight t
  :hook
  (go-mode . go-eldoc-setup))

(use-package go-tag
  :straight t
  :bind (:map go-mode-map
              ("C-c t a" . go-tag-add)
              ("C-c t r" . go-tag-remove))
  :init (setq go-tag-args (list "-transform" "camelcase")))

(use-package go-fill-struct
  :straight t)

(use-package go-impl
  :straight t)

(use-package go-playground
  :straight t)
Now within Emacs you can launch dape and select the go-attach-taskapi profile:

Profile 3: Attach to a running process
In this scenario the application is already running but you want to attach the debugger to it. First launch the application:
{
    "name": "Launch file",
    "type": "go",
    "request": "launch",
    "mode": "auto",
    "program": "${file}"
}
Find out its process ID (PID):
taskapi/
├── go.mod
├── go.sum
├── main.go
├── task_store.go
└── task_test.go
Let's add another debug profile:
import (
    "fmt"
)

type Task struct {
    ID          int    `json:"id"`
    Title       string `json:"title"`
    Description string `json:"description"`
    Done        bool   `json:"done"`
}
We'll need a helper function:
type TaskStore struct {
    tasks  map[int]Task
    nextID int
}

func NewTaskStore() *TaskStore {
    return &TaskStore{
        tasks:  make(map[int]Task),
        nextID: 1,
    }
}

Now I start the debugger:

If I now send a POST request like this one:
// CreateTask stores a given Task internally
func (ts *TaskStore) CreateTask(task Task) Task {
    task.ID = ts.nextID
    ts.tasks[task.ID] = task
    ts.nextID++
    return task
}

// GetTask retrieves a Task by ID
func (ts *TaskStore) GetTask(id int) (Task, error) {
    task, exists := ts.tasks[id]
    if !exists {
        return Task{}, fmt.Errorf("task with id %d not found", id)
    }
    return task, nil
}

// UpdateTask updates task ID with a new Task object
func (ts *TaskStore) UpdateTask(id int, task Task) error {
    if _, exists := ts.tasks[id]; !exists {
        return fmt.Errorf("task with id %d not found", id)
    }
    task.ID = id
    ts.tasks[id] = task
    return nil
}
The debugger should automatically halt at the set breakpoint:

Debugging Ginkgo Tests
Being able to debug tests in Golang is crucial. For running ginkgo tests I use ginkgo-mode which has several features:


And as an output I get:
(use-package dape
  :straight t
  :config
  ;; Pulse source line (performance hit)
  (add-hook 'dape-display-source-hook 'pulse-momentary-highlight-one-line)

  ;; To not display info and/or buffers on startup
  ;; (remove-hook 'dape-start-hook 'dape-info)
  (remove-hook 'dape-start-hook 'dape-repl))
Dape Configuration for Ginkgo
This is the basic configuration for debugging Ginkgo tests:
(use-package go-mode
  :straight t
  :mode "\.go\'"
  :hook ((before-save . gofmt-before-save))
  :bind (:map go-mode-map
              ("M-?" . godoc-at-point)
              ("M-." . xref-find-definitions)
              ("M-_" . xref-find-references)
              ;; ("M-*" . pop-tag-mark) ;; Jump back after godef-jump
              ("C-c m r" . go-run))
  :custom
  (gofmt-command "goimports"))
If I chose the go-test-ginkgo debug profile I should be able to debug the tests:

Now the configuration is quite static and therefore you cannot preselect the unit test / container. We need to somehow make the parameter -ginkgo.focus dynamic:
# Install Delve
go install github.com/go-delve/delve/cmd/dlv@latest

# Install gopls
go install golang.org/x/tools/gopls@latest

Afterwards If I have a look at the dape-configs variable I should see this value:
go install github.com/golangci/golangci-lint/cmd/golangci-lint@latest
go install github.com/onsi/ginkgo/v2/ginkgo@latest

go install -v golang.org/x/tools/cmd/godoc@latest
go install -v golang.org/x/tools/cmd/goimports@latest
go install -v github.com/stamblerre/gocode@latest
go install -v golang.org/x/tools/cmd/gorename@latest
go install -v golang.org/x/tools/cmd/guru@latest
go install -v github.com/cweill/gotests/...@latest

go install -v github.com/davidrjenni/reftools/cmd/fillstruct@latest
go install -v github.com/fatih/gomodifytags@latest
go install -v github.com/godoctor/godoctor@latest
go install -v github.com/haya14busa/gopkgs/cmd/gopkgs@latest
go install -v github.com/josharian/impl@latest
go install -v github.com/rogpeppe/godef@latest
After starting the debugger (with the debug-focused-test profile) in the dape-repl buffer I get:
(use-package ginkgo
  :straight (:type git :host github :repo "garslo/ginkgo-mode")
  :init
  (setq ginkgo-use-pwd-as-test-dir t
        ginkgo-use-default-keys t))

(use-package gotest
  :straight t
  :after go-mode
  :bind (:map go-mode-map
              ("C-c t f" . go-test-current-file)
              ("C-c t t" . go-test-current-test)
              ("C-c t j" . go-test-current-project)
              ("C-c t b" . go-test-current-benchmark)
              ("C-c t c" . go-test-current-coverage)
              ("C-c t x" . go-run)))

(use-package go-guru
  :straight t
  :hook
  (go-mode . go-guru-hl-identifier-mode))

(use-package go-projectile
  :straight t
  :after (projectile go-mode))

(use-package flycheck-golangci-lint
  :straight t
  :hook
  (go-mode . flycheck-golangci-lint-setup))

(use-package go-eldoc
  :straight t
  :hook
  (go-mode . go-eldoc-setup))

(use-package go-tag
  :straight t
  :bind (:map go-mode-map
              ("C-c t a" . go-tag-add)
              ("C-c t r" . go-tag-remove))
  :init (setq go-tag-args (list "-transform" "camelcase")))

(use-package go-fill-struct
  :straight t)

(use-package go-impl
  :straight t)

(use-package go-playground
  :straight t)
?Notice that just "1 of 5 specs" (❶) were ran, meaning that ginkgo only focussed on the container we have specified (❷).
Best Practices and Tips
Throughout my debugging experience, I have come to appreciate several best practices:
- Use version control for debugging configurations
- Maintain debug configurations in .dir-locals.el
- Use meaningful names for configurations
- Create project-specific debugging helper functions
- Make customizations locally (buffer-specific)
Resources and References
- vscode-go/docs/debugging.md at master · golang/vscode-go
- support delve/dlv dap-mode directly · Issue #318 · emacs-lsp/dap-mode
- Dape GitHub Repository
- Delve Debugger
- Eglot Documentation
- Ginkgo Testing Framework
The above is the detailed content of Mastering Golang Debugging in Emacs. For more information, please follow other related articles on the PHP Chinese website!

Hot AI Tools

Undresser.AI Undress
AI-powered app for creating realistic nude photos

AI Clothes Remover
Online AI tool for removing clothes from photos.

Undress AI Tool
Undress images for free

Clothoff.io
AI clothes remover

Video Face Swap
Swap faces in any video effortlessly with our completely free AI face swap tool!

Hot Article
Hot Tools

Notepad++7.3.1
Easy-to-use and free code editor

SublimeText3 Chinese version
Chinese version, very easy to use

Zend Studio 13.0.1
Powerful PHP integrated development environment

Dreamweaver CS6
Visual web development tools

SublimeText3 Mac version
God-level code editing software (SublimeText3)
Hot Topics


 What are the vulnerabilities of Debian OpenSSL
Apr 02, 2025 am 07:30 AM
What are the vulnerabilities of Debian OpenSSL
Apr 02, 2025 am 07:30 AM
OpenSSL, as an open source library widely used in secure communications, provides encryption algorithms, keys and certificate management functions. However, there are some known security vulnerabilities in its historical version, some of which are extremely harmful. This article will focus on common vulnerabilities and response measures for OpenSSL in Debian systems. DebianOpenSSL known vulnerabilities: OpenSSL has experienced several serious vulnerabilities, such as: Heart Bleeding Vulnerability (CVE-2014-0160): This vulnerability affects OpenSSL 1.0.1 to 1.0.1f and 1.0.2 to 1.0.2 beta versions. An attacker can use this vulnerability to unauthorized read sensitive information on the server, including encryption keys, etc.
 What libraries are used for floating point number operations in Go?
Apr 02, 2025 pm 02:06 PM
What libraries are used for floating point number operations in Go?
Apr 02, 2025 pm 02:06 PM
The library used for floating-point number operation in Go language introduces how to ensure the accuracy is...
 Transforming from front-end to back-end development, is it more promising to learn Java or Golang?
Apr 02, 2025 am 09:12 AM
Transforming from front-end to back-end development, is it more promising to learn Java or Golang?
Apr 02, 2025 am 09:12 AM
Backend learning path: The exploration journey from front-end to back-end As a back-end beginner who transforms from front-end development, you already have the foundation of nodejs,...
 What is the problem with Queue thread in Go's crawler Colly?
Apr 02, 2025 pm 02:09 PM
What is the problem with Queue thread in Go's crawler Colly?
Apr 02, 2025 pm 02:09 PM
Queue threading problem in Go crawler Colly explores the problem of using the Colly crawler library in Go language, developers often encounter problems with threads and request queues. �...
 In Go, why does printing strings with Println and string() functions have different effects?
Apr 02, 2025 pm 02:03 PM
In Go, why does printing strings with Println and string() functions have different effects?
Apr 02, 2025 pm 02:03 PM
The difference between string printing in Go language: The difference in the effect of using Println and string() functions is in Go...
 How to specify the database associated with the model in Beego ORM?
Apr 02, 2025 pm 03:54 PM
How to specify the database associated with the model in Beego ORM?
Apr 02, 2025 pm 03:54 PM
Under the BeegoORM framework, how to specify the database associated with the model? Many Beego projects require multiple databases to be operated simultaneously. When using Beego...
 How to solve the user_id type conversion problem when using Redis Stream to implement message queues in Go language?
Apr 02, 2025 pm 04:54 PM
How to solve the user_id type conversion problem when using Redis Stream to implement message queues in Go language?
Apr 02, 2025 pm 04:54 PM
The problem of using RedisStream to implement message queues in Go language is using Go language and Redis...
 PostgreSQL monitoring method under Debian
Apr 02, 2025 am 07:27 AM
PostgreSQL monitoring method under Debian
Apr 02, 2025 am 07:27 AM
This article introduces a variety of methods and tools to monitor PostgreSQL databases under the Debian system, helping you to fully grasp database performance monitoring. 1. Use PostgreSQL to build-in monitoring view PostgreSQL itself provides multiple views for monitoring database activities: pg_stat_activity: displays database activities in real time, including connections, queries, transactions and other information. pg_stat_replication: Monitors replication status, especially suitable for stream replication clusters. pg_stat_database: Provides database statistics, such as database size, transaction commit/rollback times and other key indicators. 2. Use log analysis tool pgBadg
