
 Web Front-end
JS Tutorial
Decoding Setlist Uniqueness: A Data-Driven Analysis of Live Performances
Web Front-end
JS Tutorial
Decoding Setlist Uniqueness: A Data-Driven Analysis of Live Performances
Decoding Setlist Uniqueness: A Data-Driven Analysis of Live Performances

Analyzing the Uniqueness of Live Music Performances: A Data-Driven Approach
I had an idea: quantify the uniqueness of a band's live show by analyzing their past setlists. My initial research revealed a helpful blog post, "Digging into concert setlist data: Which artists play the same songs over and over?" While insightful and using Tableau for visualization (a powerful data visualization tool creating interactive dashboards), I wanted to delve deeper, particularly into newer artists and without the cost of Tableau. I decided to build my own data analysis tool using the same data source, setlist.fm, connecting directly via their API. My tech stack? Node.js, for its scalability and robust ecosystem. The project's code is available on GitHub: Setlist-Analysis.
Calculating Uniqueness Scores
The core of my analysis involves several algorithms to assess setlist uniqueness and diversity:
- Song Uniqueness Score: Measures how frequently songs are repeated across an artist's setlists within a year. Higher scores signify greater song variety.
- Setlist Uniqueness Score: Evaluates the distinctiveness of each setlist within a year. Artists with rarely repeated setlists receive higher scores.
- Sequence Uniqueness Score: Analyzes the order of songs, identifying recurring patterns. Less frequent sequences earn higher scores.
- Total Uniqueness Score: A composite score combining the above three metrics for a comprehensive measure of live performance variability.
Setlist Sequence Analysis: A Case Study
My application uniquely analyzes song sequences within setlists to determine the longest repeated sequence for a given year. Consider this example:
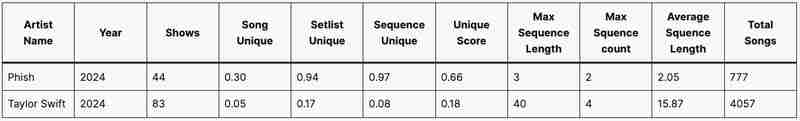
This comparison highlights contrasting setlist strategies:
Phish: High uniqueness scores across all metrics and short sequence lengths (maximum 3, average 2.05) reflect their improvisational style and unique setlists for each show.
Taylor Swift: Lower uniqueness scores and long sequence lengths (maximum 40, average 15.87) indicate a consistent, highly-rehearsed approach prioritizing a predictable fan experience.
Visualizing Setlist Variation
The following chart visualizes the differences using Song Uniqueness Score and Average Sequence Length. Bubble size represents Average Sequence Length:

This clearly distinguishes Phish's varied approach from Taylor Swift's consistent setlist structure.
Future Enhancements and Challenges
Future features include:
- Rarity Score: Identifies infrequently played songs.
- Recency Score: Measures the proportion of recent material in live sets.
Initial challenges included API familiarity. Spotify's API, initially planned for artist data, removed the relevant feature (as of November 27, 2024), necessitating reliance solely on setlist.fm. Spotify might be re-integrated later for album art and metadata.
Future plans involve:
- Implementing the Rarity and Recency Scores.
- Developing a user-friendly dashboard for fans.
- Analyzing genre and era trends in live performance patterns.
This project blends my passion for music and data analysis. I'm eager to see its evolution and share further insights.
The above is the detailed content of Decoding Setlist Uniqueness: A Data-Driven Analysis of Live Performances. For more information, please follow other related articles on the PHP Chinese website!

Hot AI Tools

Undresser.AI Undress
AI-powered app for creating realistic nude photos

AI Clothes Remover
Online AI tool for removing clothes from photos.

Undress AI Tool
Undress images for free

Clothoff.io
AI clothes remover

AI Hentai Generator
Generate AI Hentai for free.

Hot Article
Hot Tools

Notepad++7.3.1
Easy-to-use and free code editor

SublimeText3 Chinese version
Chinese version, very easy to use

Zend Studio 13.0.1
Powerful PHP integrated development environment

Dreamweaver CS6
Visual web development tools

SublimeText3 Mac version
God-level code editing software (SublimeText3)
Hot Topics
 1377
1377
 52
52

 How do I create and publish my own JavaScript libraries?
Mar 18, 2025 pm 03:12 PM
How do I create and publish my own JavaScript libraries?
Mar 18, 2025 pm 03:12 PM
Article discusses creating, publishing, and maintaining JavaScript libraries, focusing on planning, development, testing, documentation, and promotion strategies.
 How do I optimize JavaScript code for performance in the browser?
Mar 18, 2025 pm 03:14 PM
How do I optimize JavaScript code for performance in the browser?
Mar 18, 2025 pm 03:14 PM
The article discusses strategies for optimizing JavaScript performance in browsers, focusing on reducing execution time and minimizing impact on page load speed.
 What should I do if I encounter garbled code printing for front-end thermal paper receipts?
Apr 04, 2025 pm 02:42 PM
What should I do if I encounter garbled code printing for front-end thermal paper receipts?
Apr 04, 2025 pm 02:42 PM
Frequently Asked Questions and Solutions for Front-end Thermal Paper Ticket Printing In Front-end Development, Ticket Printing is a common requirement. However, many developers are implementing...
 How do I debug JavaScript code effectively using browser developer tools?
Mar 18, 2025 pm 03:16 PM
How do I debug JavaScript code effectively using browser developer tools?
Mar 18, 2025 pm 03:16 PM
The article discusses effective JavaScript debugging using browser developer tools, focusing on setting breakpoints, using the console, and analyzing performance.
 How do I use Java's collections framework effectively?
Mar 13, 2025 pm 12:28 PM
How do I use Java's collections framework effectively?
Mar 13, 2025 pm 12:28 PM
This article explores effective use of Java's Collections Framework. It emphasizes choosing appropriate collections (List, Set, Map, Queue) based on data structure, performance needs, and thread safety. Optimizing collection usage through efficient
 How do I use source maps to debug minified JavaScript code?
Mar 18, 2025 pm 03:17 PM
How do I use source maps to debug minified JavaScript code?
Mar 18, 2025 pm 03:17 PM
The article explains how to use source maps to debug minified JavaScript by mapping it back to the original code. It discusses enabling source maps, setting breakpoints, and using tools like Chrome DevTools and Webpack.
 Getting Started With Chart.js: Pie, Doughnut, and Bubble Charts
Mar 15, 2025 am 09:19 AM
Getting Started With Chart.js: Pie, Doughnut, and Bubble Charts
Mar 15, 2025 am 09:19 AM
This tutorial will explain how to create pie, ring, and bubble charts using Chart.js. Previously, we have learned four chart types of Chart.js: line chart and bar chart (tutorial 2), as well as radar chart and polar region chart (tutorial 3). Create pie and ring charts Pie charts and ring charts are ideal for showing the proportions of a whole that is divided into different parts. For example, a pie chart can be used to show the percentage of male lions, female lions and young lions in a safari, or the percentage of votes that different candidates receive in the election. Pie charts are only suitable for comparing single parameters or datasets. It should be noted that the pie chart cannot draw entities with zero value because the angle of the fan in the pie chart depends on the numerical size of the data point. This means any entity with zero proportion
 Who gets paid more Python or JavaScript?
Apr 04, 2025 am 12:09 AM
Who gets paid more Python or JavaScript?
Apr 04, 2025 am 12:09 AM
There is no absolute salary for Python and JavaScript developers, depending on skills and industry needs. 1. Python may be paid more in data science and machine learning. 2. JavaScript has great demand in front-end and full-stack development, and its salary is also considerable. 3. Influencing factors include experience, geographical location, company size and specific skills.
