

In-depth discussion of web page first screen loading performance and optimization strategies

With the boom in AI-driven code generation, the importance of writing React code is declining. Now anyone and anything can write applications in React. But writing code has always been only part of the puzzle. We still need to deploy our applications somewhere, expose them to users, make them robust, make them fast, and do a million other things. No AI can take over these. At least not yet.
So let’s focus on how to make your application fast today. To do this, we need to step away from React for a while. Because before making something fast, we first need to know what "fast" is, how to measure it, and what can affect that "fast".
Spoiler alert: React will not appear in this article except for learning projects. Today is all about the basics: how to use performance tools, an introduction to Core Web Vitals, the Chrome performance panel, what initial load performance is, what metrics can measure it, and how cache controls and different network conditions affect it.
What happens when I open my browser and try to navigate to my favorite website? I type "https://www.php.cn/link/63ea3fef646010a7255aec506626ea32 into the address bar to make a GET request and receive an HTML page in return.

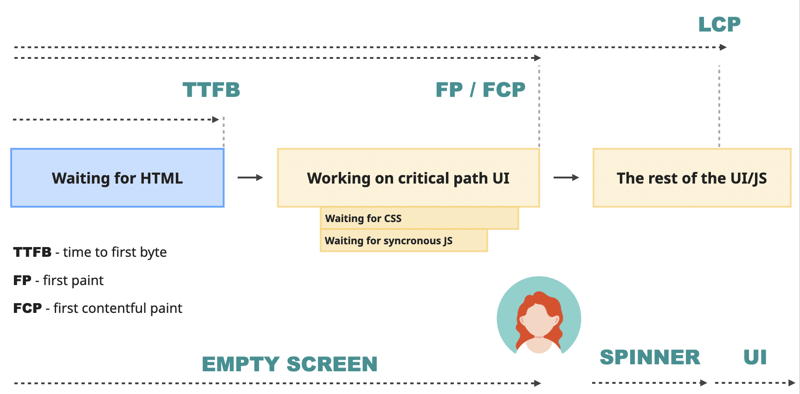
The time it takes to do this is called "Time To First Byte" (TTFB): the time between when the request is sent and when the results start arriving. After receiving the HTML, the browser must now convert this HTML into a usable website as quickly as possible.
It first renders what is called the "critical path" on the screen: the smallest and most important content that can be shown to the user.

Exactly what should be included in the critical path is a complex question. Ideally, everything is designed to allow users to see the full experience immediately. But again - nothing, since it needs to be as fast as possible since it's a "critical" path. It's impossible to do both at the same time, so a compromise is required.
The compromise is this. The browser assumes that to build the "critical path" it absolutely requires at least the following types of resources:
The browser gets the first one (HTML) in the initial request to the server. It starts parsing it and in doing so extracts links to the CSS and JS files it needs to complete the "critical path". It then sends requests to get them from the server, waits for them to download, processes them, puts it all together, and at the end of a certain moment, draws the "critical path" pixels on the screen.
Because the browser cannot complete the initial rendering without these critical resources, they are called "render-blocking resources". Of course, not all CSS and JS resources are render-blocking. Usually only:
The entire process of rendering the "critical path" looks roughly like this:
This point in time is what we call the First Draw (FP). This is the first time the user has a chance to see something on the screen. Whether this happens depends on the HTML sent by the server. If there is something meaningful there, such as text or an image, this point will also be when the first content paint (FCP) occurs. If the HTML is just an empty div, then FCP will happen later.

First Content Paint (FCP) is one of the most important performance metrics because it measures the perceived initial load. Basically, this is a user’s initial impression of your site’s speed.
Until this moment, the user was just staring at the blank screen to bite nails. According to Google, the good FCP number is below 1.8 seconds . After that, the user will start to lose interest in the content that your website can provide and may begin to leave.
However, FCP is not perfect. If the website starts loading with a rotor or some loading screen, the FCP indicator will represent the content. But it is unlikely that users are just navigating to the website to view the fancy loading screen. Most of the time, they want to access the content.
For this reason, the browser needs to complete its start. It is waiting for the rest of the non -blocking JavaScript, execute it, and applies its changes to the DOM on the screen, download images, and improve the user experience in other ways.
At a certain point in the process, the maximum content drawing time will occur. It is not the first element like FCP, but the largest text, image or video visible in the main content area on the page -the visible port. According to Google, this number should be below 2.5 seconds . More than this number, users will think that the website is slow.
-Three indicators represent the different parts of the user experience. LCP Responsible Loading performance . These indicators can be measured through lighthouse. Lighthouse is a Google performance tool. It is integrated into Chrome Devtools and can also run through the shell script, web interface or node module. You can use it as a node module so that they can run it during the construction and detect them before returning in the production environment. Use the integrated DEVTools version for local debugging and testing. And the web version to check the performance of competitors.
Overvtools overviewThe above is a very brief and simplified explanation of the process. But there are many abbreviations and theories that make people confused. For me personally, reading such content is useless. Unless I can see it in action and can operate it myself, I will immediately forget everything.
Project settings
If you are willing, you can perform all the following simulation on your own project -the results should be more or less. However, in order to be more controllable and simplified, I suggest you use the learning project I prepared for this article. You can visit it here:
https://www.php.cn/link/def14e8541708294d7558fdf2126EF27 First install all dependencies: Build project: Start the server: You should go to "https://www.php.cn/link/66e8d052ec2230c66bd11ee6b5a0e3c8. Open the website you want to analyze in Chrome and open Chrome DevTools. Find the Performance and Lighthouse panels there and put them together. We need both. Also, before doing anything else in this article, make sure the "Disable Cache" checkbox is enabled. It should be in the topmost Network panel. This way we can simulate first-time visitors - people who have never been to our website and haven't cached any resources yet. Now open the Lighthouse panel. You should see some settings and an "Analyze Page Load" button there. For this section, we are interested in the "Navigation" pattern - which will provide a detailed analysis of the initial load of the page. The report will give you a score like this: Local performance is flawless, no surprise - everything just "runs on my machine". There will also be the following indicators: The FCP and LCP values we need for this article are right at the top. Below, you'll see a list of suggestions that can help you improve your score. Each suggestion can be expanded, where you will find more detailed information and sometimes links explaining that specific topic. Not all of these are actionable, but it's a great tool to start learning about performance and understanding the different things that can improve it. You could spend hours just reading these reports and related links. However, Lighthouse only provides surface information and does not allow you to simulate different scenarios such as slow network or low CPU. It's just a great entry point and a great tool for tracking performance over time. To get a deeper understanding of what's going on, we need the Performance panel. When first loaded, the Performance panel should look like this: It displays three core Web Vitals metrics, one of which is our LCP, allowing you to simulate slow networks and CPUs, as well as the ability to log performance details over time. Find and select the "Screenshot" checkbox at the top of the panel, then click the "Record and Reload" button and when the website reloads itself - stop recording. This will be your detailed report of what happened to your page during its initial load. This report will contain several sections. At the very top is the regular "Timeline Overview" section. Here you will see something happening on the site, but nothing more. When you hover over it - a screenshot of what's going on will be displayed, and you'll be able to select and zoom into a specific range for a closer look. Underneath is the Network section. Once expanded, you'll see all external resources being downloaded and their exact time on the timeline. When you hover over a specific resource, you'll see details about how much time was spent at which stage of the download. Resources with a red corner will indicate blocking resources. If you are using the learning project, you will see the exact same picture, and this one matches word for word what we went through in the previous section: If you now open your learning project code and view the dist folder, the source code will match this behavior: If you are working on a project, take note of its initial load performance and look at the Network panel. You may see more resources being downloaded. Under the "network" section, you can find the "frame" and "timing" section.
Part. This is what happened in the main thread during the time axis of the recorded timeline.
We can see what such as "parsing HTML" or "layout" and how long it costs. The yellow part is related to JavaScript, and they are a bit useless because we use a production version with compressing JavaScript. But even in this state, it allows us to generally understand how long the JavaScript execution is compared with HTML analysis and drawing layout, such as. and both open and amplify to occupy the entire screen, it is particularly useful for performance analysis.
From here, I can see that my server is very fast, and the bundle bag is very small. No network task is a bottleneck; they do not need any time. Between them, the browser is just strolling and doing its own business. Therefore, if I want to speed up the initial loading speed here, I need to study why "resolution HTML" is so slow -it is the longest task on the chart. or, if we look at the absolute number -I should not do anything here, in terms of performance. The entire initial loading time is less than 200 milliseconds, far lower than the threshold recommended by Google? But this is happening because I run this test locally (therefore no actual network cost), on a very fast laptop computer, and and and and, and also, and Use a very basic server. First, let us make the server more realistic. Now, the first "blue" step is about 50 milliseconds, of which 40 milliseconds are just waiting.
https://www.php.cn/link/def14e8541708294d7558fdf2126EF27). Find the comments > // AWAIT SLEEP (500) and cancel the annotation. This will delay the server 500 milliseconds before returning HTML -this seems reasonable for old complex servers.
Re -construct the project (NPM Run Build), restart it (NPM Run Start) and re -run the performance record. Except for the initial blue line, there is no change on the timeline -compared with the rest, it is very long now. This situation highlights the importance of checking the global and identifying bottlenecks before performing any performance optimization. The LCP value is about 650 milliseconds, of which about 560 milliseconds are used to wait for the initial HTML. Its React part is about 50 milliseconds. Even if I try to reduce it and reduce it to 25 milliseconds, it is only 4%in the overall situation. The reduction of it will require a lot of Simulate different bandwidth and delay
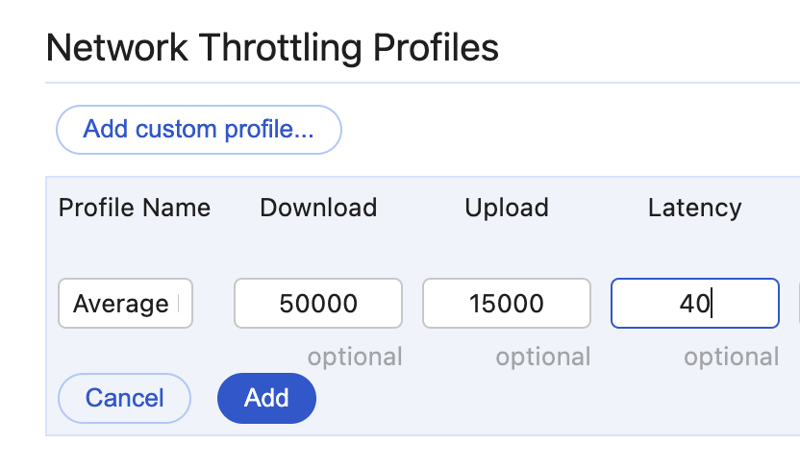
Not everyone lives in a world of 1 Gigabit connection. For example, in Australia, 50 trillion/second is one of the high -speed Internet connections, and you will spend about $ 90 per month. Of course, it is not 3G, and many people around the world are trapped. But still, every time I hear the Europeans' 1 Gigabit 1/second or 10 euro Internet plan, I will cry. If it does not appear in your Chrome version, the same settings should be available in the "network" tab. Add a new configuration file to the "network" drop -down menu, use the following numbers: Now select the profile in the drop-down menu and run the performance recording again. What did you see? To me it looks like this. LCP value barely changed - a slight increase from 640 ms to 700 ms. There are no changes to the initial blue "Server" section, which is explainable: it only sends the most basic HTML, so it shouldn't take long to download. But the relationship between downloadable resources and the main thread has changed dramatically. I can now clearly see the impact of render-blocking CSS files. The "parse HTML" task has completed, but the browser is idle and waiting for CSS - nothing can be drawn until it is downloaded. Compare this to the previous image, where the resources were downloaded almost instantly while the browser was parsing the HTML. Afterwards, technically the browser could have drawn something - but there's nothing and we're just sent an empty div in the HTML file. Therefore, the browser continues to wait until the javascript file is downloaded and executed. This ~60ms wait gap is exactly what I'm seeing as an increase in LCP. Slow down the speed further to see how it goes. Create a new network profile, name it "Low Internet Bandwidth", copy the download/upload numbers from the "Low Internet Bandwidth" profile, and set the delay to 40 milliseconds. And run the test again. LCP value has now increased to almost 500ms. JavaScript download takes approximately 300 milliseconds. Relatively speaking, the importance of "parsing HTML" tasks and JavaScript execution tasks is decreasing. If you have your own project, try running this test on it. What happens inside the resource bar is also interesting. Hover over the yellow JavaScript bar. You should see something like this there: The most interesting part here is the "send request and wait", which takes about 40ms. Hover over the rest of the web resources - all of them will have it. That's our latency, our network latency set to 40. Many things can affect latency numbers. The type of network connection is one of them. For example, the average 3G connection has a bandwidth of 10/1 Mbps and a latency of between 100 and 300 milliseconds. To simulate this, create a new network profile, name it "Average 3G", copy the download/upload numbers from the "Low Internet Bandwidth" profile, and set the latency to 300ms. Run the analysis again. Send request and wait should be increased to approximately 300 milliseconds for all network resources. This will push the LCP even further Numbers: 1.2 seconds for me. Now for the fun part: what happens if I turn the bandwidth back up to superfast but keep the latency low? Let’s try this setup: This can easily happen if your server is somewhere in Norway and the client is a wealthy Australian. This is the result: LCP The number is about 960 milliseconds. It was worse than the slowest internet speed we had ever tried before! In this case, bundle size doesn't matter and CSS size doesn't matter at all. Even if you cut both in half, the LCP indicator barely moves. High latency trumps everything. This brings me to the first performance improvement everyone should implement if they haven’t already. It's called "Ensuring static resources are always served via a CDN". A CDN (Content Delivery Network) is basically step 0 of any front-end performance related effort, even before you start thinking about fancier stuff like code splitting or server components. The main purpose of any CDN (Content Delivery Network) is to reduce latency and deliver content to the end user as quickly as possible. They implement various strategies to do this. The two most important ones in this article are "distributed server" and "caching". A CDN provider will have multiple servers in different geographical locations. These servers can store copies of static resources and send them to users when the browser requests them. A CDN is basically a soft layer around your origin server, protecting it from outside influences and minimizing its interaction with the outside world. It's kind of like an AI assistant for introverts that can handle typical conversations without involving a real person. In the example above, our server is in Norway and the client is in Australia, we have an image like this: With a CDN in the middle, the image changes. The CDN will have a server closer to the user, for example also somewhere in Australia. At some point, the CDN will receive a copy of the static resource from the origin server. Users from Australia or anywhere nearby will then get these copies instead of the original ones from the Norwegian server. It achieves two important things. First, the load on the origin server is reduced because users no longer need to access it directly. Second, users can now get these resources faster because they no longer have to cross an ocean to download some JavaScript files. And the LCP value in our simulation above dropped from 960 ms to 640 ms?. So far we’ve only discussed first-time visit performance – performance for people who have never visited your site. But hopefully the site is so good that most first-time visitors will become regular visitors. Or at least they won’t leave after the first load, browse a few pages, and maybe buy something. In this case we typically expect the browser to cache static resources (like CSS and JS) - i.e. save a copy of them locally rather than always downloading them. Let’s see how the performance graph and numbers change in this case. Open the learning project again. In the dev tools, set Network to the "Average 3G" we created earlier - with high latency and low bandwidth so we can see the difference right away. And make sure the "Disable network cache" checkbox is unchecked. First, refresh your browser to make sure we’re eliminating first-time visitors. Then refresh and measure performance. If you are using a learning project, the end result may be a little surprising as it will look like this: CSS and JavaScript files are still very prominent in the Network tab and I see them with around 300ms in "Send Request and Wait" - the latency setting we set in the "Average 3G" profile. As a result, LCP is not as low as it could be, and I have a 300ms gap when the browser is just waiting for blocking CSS. What happened? Shouldn't browsers cache this stuff? We now need to use the Network panel to understand what is going on. Open it and find the CSS file there. It should look like this: The most interesting things here are the "Status" column and "Size". In "Size", it's definitely not the size of the entire CSS file. It's too small. In "Status", it's not our usual 200 "everything is fine" status, but something different - a 304 status. Two questions here - why 304 instead of 200, and why was the request sent at all? Why doesn't caching work? First, 304 response. This is the response a well-configured server sends for a conditional request - where the response changes based on various rules. Such requests are often used to control browser cache. For example, when the server receives a request for a CSS file, it can check when the file was last modified. If this date is the same as the date in the browser-side cache file, it will return a 304 with an empty body (that's why it's only 223 B). This means the browser can safely reuse files it already owns. No need to waste bandwidth and re-download it again. This is why we see the big "send request and wait" numbers in the performance pictures - the browser is asking the server to confirm that the CSS file is still up to date. That's why the "content download" there is 0.33ms - the server returns "304 Unmodified" and the browser just reuses the previously downloaded file. Now, for the second question - why was this request sent at all? This behavior is controlled by the Cache-Control header that the server sets in response. Click the CSS file in the Network panel to view request/response details. Look for the "Cache-Control" value in the "Response Headers" block of the "Headers" tab:
You can store this response in your cache, but you need to verify with me again after a while.
However, we can easily change this -we only need to change the max -age number to 0 to 31536000 (one year, the maximum number of seconds). To this end, in your learning project, transfer to Backend/Index.ts file, find the position of setting Max-Age = 0, and change it to 31536000 (one year). Refresh the page several times, you should see the following content of the CSS file in the "Network" tab:
The result should be similar to: Although the delay is high, the "sending request and waiting" section is almost reduced to zero. The gap between "analysis of HTML" and JavaScript evaluation has almost disappeared, and our LCP value returns to ~ 650 milliseconds. Does the above information mean that the cache is our performance of a pirate. Should we cache everything as much as possible? Definitely not! In addition to everything else, the possibility of creating a combination of "not proficient technology" and "need to explain how to clear the browser cache" will cause the most senior developers to have panic attacks. There are millions of methods of optimizing cache, millions of instructions in the Cache-Control header and other combinations that may not affect the cache duration. Realization of the server. Maybe only this theme itself can write a few books. If you want to be a cache master, start with articles on https://web.dev/ and MDN resources, and then operate according to bread crumbs. Unfortunately, no one can tell you, "This is the five best cache strategies suitable for all content." At best, the answer may be: "If you have this use case, combined with this, this, and this, then this cache setting combination is a good choice, but pay attention to these issues." All this is attributed to understanding your resources, building systems, frequency of resource changes, cache security, and the consequences of error operation. But there is an exception. One exception is the clear "best practice": JavaScript and CSS files using a website constructed by modern tools. Modern packaging tools (such as VITE, ROLLUP, Webpack, etc.) can create "unsusable" JS and CSS files. Of course, they are not really "unchanged". However, these tools use the hash string dependent on file content to generate file names. If the content of the file is changed, the hash will be changed and the file name will be changed. As a result, when the website is deployed, no matter what the cache settings, the browser will re -obtain a new copy of the file. The cache has "cleared", just like when we manually renamed the CSS file before. For example, check the distal/assets folder in the learning project. Both JS and CSS files have index- [hash] file names. Remember these names and run NPM Run Build several times. The name remains unchanged because the content of these documents has not changed. Now go to the src/app.tsx file and add content similar to the console.log ('Bla') somewhere. Run NPM Run Build again and check the generated files. You should see that the CSS file name remains unchanged, but the JS file name has been changed. When this website is deployed and the next time the user visits it, the browser will request a completely different JS file that has never appeared in its cache. The cache has been cleared. Find the equivalence of the design folder of the project and run your constructing command. If your construction system is configured -you are lucky. You can safely configure the server to set the maximum MAX-AGE header to generate assets. If you also control all the image -better, you can also include the image into the list. According to the website and their users and their behaviors, this may provide you with a very good performance improvement for the initial loading. At this time, you may be thinking about such things, "You are crazy. I built a simple website with Next.js on the weekend and deploy it to Vercel/Netlify/Hottestnewprovider within 2 minutes. Of course, These modern tools will handle all these. "This is fair. I think so too. But then I actually checked it, wow, I am surprised? My two items have MAX-AGE = 0 and Must-Revalidate for CSS and JS files. It turns out that this is the default setting of my CDN provider ?? ♀️. Of course, they have reasons <code>npm install</code>
<code>npm run build</code>
<code>npm run start</code>
Explore essential DevTools

Explore the Lighthouse panel


Explore the Performance Panel


Additional exercises


Explore different network conditions
Very slow server

 efforts. A more effective strategy may be to focus on the server and find out why it is so slow.
 anyway. Let us simulate this unpleasant Australian Internet and see what happens in performance indicators. To this end, clear the existing records in the Performance tab (reloading and the button near the record button). The network setting panel should be displayed:


Additional exercises


Importance of CDN


Repeat access performance


Control browser cache using the Cache-Control header

Additional exercises

By the way, you can keep the cache time exactly
verify with the server, and never use the cache immediately.  Now, for all the main points of processing the cache header: let us measure the performance of the page again. Do not forget to set the "average 3G" configuration file settings and keep the "disable cache" settings.
 additional exercise
Cache-Control and modern packaging tools
additional exercise
My simple case really needs to know all these?
The above is the detailed content of Initial load performance for React developers: investigative deep dive. For more information, please follow other related articles on the PHP Chinese website!


![[Web front-end] Node.js quick start](https://img.php.cn/upload/course/000/000/067/662b5d34ba7c0227.png)


