


(This article was originally published by Ampere Computing)
Your application runs on a new cloud instance or server (or SUT, system under test), you find performance issues, or you want to ensure optimal performance under available system resources. This article discusses some basic questions you should ask and ways to answer them.
Prerequisite: Understand your virtual machine or server
You need to know the available system resources before starting a troubleshooting or performing a performance analysis exercise. System-level performance usually boils down to four components and their interactions - CPU, memory, network, and disk. See also Brendan Gregg's excellent article "Linux Performance Analysis: 60000 millisecond Quick Result Guide", a great starting point for quickly evaluating performance issues.
This article explains how to understand performance issues more deeply.
Confirm CPU type
Run the $lscpu command, which will display CPU type, CPU frequency, number of cores, and other CPU-related information:
<code>ampere@colo1:~$ lscpu

Architecture:                    aarch64

CPU op-mode(s):                  32-bit, 64-bit

Byte Order:                      Little Endian

CPU(s):                          160

On-line CPU(s) list:             0-159

Thread(s) per core:              1

Core(s) per socket:              80

Socket(s):                       2

NUMA node(s):                    2

Vendor ID:                       ARM

Model:                           1

Model name:                      Neoverse-N1

Stepping:                        r3p1

CPU max MHz:                     3000.0000

CPU min MHz:                     1000.0000

BogoMIPS:                        50.00

L1d cache:                       10 MiB

L1i cache:                       10 MiB

L2 cache:                        160 MiB

NUMA node0 CPU(s):               0-79

NUMA node1 CPU(s):               80-159

Vulnerability Itlb multibit:     Not affected

Vulnerability L1tf:              Not affected

Vulnerability Mds:               Not affected

Vulnerability Meltdown:          Not affected

Vulnerability Mmio stale data:   Not affected

Vulnerability Spec store bypass: Mitigation; Speculative Store Bypass disabled via prctl

Vulnerability Spectre v1:        Mitigation; __user pointer sanitization

Vulnerability Spectre v2:        Mitigation; CSV2, BHB

Vulnerability Srbds:             Not affected

Vulnerability Tsx async abort:   Not affected

Flags:                           fp asimd evtstrm aes pmull sha1 sha2 crc32 atomics fphp asimdhp cpuid

asimdrdm lrcpc dcpop asimddp ssbs </code>Confirm the memory configuration
Run the $free command, which will provide information about physical memory and total amount of swap memory (including a breakdown of memory utilization). Run the Multichase benchmark to determine latency, memory bandwidth, and load latency for instance/SUT:
<code>ampere@colo1:~$ free

              total        used        free      shared  buff/cache   available

Mem:      130256992     3422844   120742736        4208     6091412   125852984

Swap:       8388604           0     8388604
</code>Evaluate network capabilities
Run the $ethtool command, which will provide information about the NIC card hardware settings. It is also used to control network device drivers and hardware settings. If you are running a workload in a client-server model, it is best to understand the bandwidth and latency between the client and the server. To determine the bandwidth, a simple iperf3 test is sufficient, and for latency a simple ping test can provide this value. In the client-server settings, it is also recommended to keep the network hop count to a minimum. traceroute is a network diagnostic command that displays routing and measures the transmission delay of packets across the network:
<code>ampere@colo1:~$ ethtool -i enp1s0np0

driver: mlx5_core

version: 5.7-1.0.2

firmware-version: 16.32.1010 (RCP0000000001)

expansion-rom-version:

bus-info: 0000:01:00.0

supports-statistics: yes

supports-test: yes

supports-eeprom-access: no

supports-register-dump: no

supports-priv-flags: yes>
</code>
Understand Storage Infrastructure
Before starting to run a workload, it is crucial to understand disk functionality. Understanding the throughput and latency of disk and file systems will help you plan and design your workloads efficiently. Flexible I/O (or "fio") is an ideal tool for determining these values.
Now enter the top ten questions
One of the main components of total cost of ownership is the CPU. Therefore, it is worth understanding the efficiency of CPU usage. An idle CPU usually means that there are external dependencies, such as waiting for disk or network access. It is always recommended to monitor CPU utilization and check that the core usage is even.
The following image shows an example output of the $top -1 command.

Modern CPUs use the p state to adjust the frequency and voltage of their operation to reduce CPU power consumption when higher frequencies are not required. This is called Dynamic Voltage and Frequency Scaling (DVFS), and is managed by the operating system. In Linux, the p state is managed by the CPUFreq subsystem, which uses different algorithms (called regulators) to determine the frequency of the CPU running. In general, for performance-sensitive applications, it is best to ensure that you use a performance regulator, and the following command uses the cpupower utility to achieve this. Remember that the frequency utilization of the CPU should run depends on the workload:
<code>ampere@colo1:~$ lscpu

Architecture:                    aarch64

CPU op-mode(s):                  32-bit, 64-bit

Byte Order:                      Little Endian

CPU(s):                          160

On-line CPU(s) list:             0-159

Thread(s) per core:              1

Core(s) per socket:              80

Socket(s):                       2

NUMA node(s):                    2

Vendor ID:                       ARM

Model:                           1

Model name:                      Neoverse-N1

Stepping:                        r3p1

CPU max MHz:                     3000.0000

CPU min MHz:                     1000.0000

BogoMIPS:                        50.00

L1d cache:                       10 MiB

L1i cache:                       10 MiB

L2 cache:                        160 MiB

NUMA node0 CPU(s):               0-79

NUMA node1 CPU(s):               80-159

Vulnerability Itlb multibit:     Not affected

Vulnerability L1tf:              Not affected

Vulnerability Mds:               Not affected

Vulnerability Meltdown:          Not affected

Vulnerability Mmio stale data:   Not affected

Vulnerability Spec store bypass: Mitigation; Speculative Store Bypass disabled via prctl

Vulnerability Spectre v1:        Mitigation; __user pointer sanitization

Vulnerability Spectre v2:        Mitigation; CSV2, BHB

Vulnerability Srbds:             Not affected

Vulnerability Tsx async abort:   Not affected

Flags:                           fp asimd evtstrm aes pmull sha1 sha2 crc32 atomics fphp asimdhp cpuid

asimdrdm lrcpc dcpop asimddp ssbs </code>To check the frequency of the CPU when running the application, run the following command:
<code>ampere@colo1:~$ free

              total        used        free      shared  buff/cache   available

Mem:      130256992     3422844   120742736        4208     6091412   125852984

Swap:       8388604           0     8388604
</code>Sometimes it is necessary to find out whether the percentage of CPU time is consumed in user space or in privileged time (i.e. kernel space). Higher kernel time may be reasonable for certain categories of workloads (such as network binding workloads), but may also indicate a problem.
Linux application top can be used to find out how long the user and kernel time is consumed, as shown below.
mpstat - Check the statistics of each CPU and check the individual hotspot/busy CPUs. This is a multiprocessor statistics tool that reports statistics for each CPU (-P option)

To identify CPU usage for each CPU and display the user time/core time ratio, %usr, %sys, and %idle are the key values. These key values can also help identify "hotspots" CPUs that may be caused by single-threaded applications or interrupt mappings.
When you manage the server, you may have to install a new application, or you may notice that the application has started to slow down. To manage system resources and understand the system memory and system memory utilization that the system has installed, the $free command is a valuable tool. $vmstat is also a valuable tool for monitoring memory utilization, especially if you are actively exchanging memory with virtual memory.
free. The Linux free command displays memory and exchange statistics.

Output displays the total memory, used memory and available memory of the system. An important column is the available value, which shows the memory available to the application and needs to be swapped. It also considers memory that cannot be recycled immediately.
vmstat. This command provides a high-level view of system memory, health, including currently available memory and paging statistics.
$vmstat command displays the active memory being swapped (paging).

These commands print a summary of the current status. The column defaults to kilobytes, which are:
If si and so are non-zero, the system is under memory pressure and is swapping memory to the swap device.
To understand enough memory bandwidth, first obtain the system's "maximum memory bandwidth" value. The "Maximum Memory Bandwidth" value can be found in the following ways:
This value represents the theoretical maximum bandwidth of the system, also known as the "burst rate". You can now run Multichase or bandwidth benchmarks on your system and verify these values.
Note: The burst rate has been found to be unsustainable and the implemented values may be slightly smaller than the calculated values.
When running a workload on a server, as part of performance tuning or troubleshooting, you may want to know which CPU core a particular process is currently scheduled on and how resource utilization of processes running on that CPU core. The first step is to find the process running on the CPU core. This can be done using htop. CPU values are not reflected in the default display of htop. To get the CPU core value, start $htop from the command line, press F2 key, go to Columns, and add Processor under Available Columns. The "CPU ID" currently used by each process will appear under the "CPU" column.
How to configure $htop to display CPU/core:

Show core 4-6 The $htop command to reach the maximum value (htop core count starts at "1" instead of "0"):

$mpstat Command for checking selected cores of statistics:

Once you have identified the CPU core, you can run the $mpstat command to check the statistics for each CPU and check the individual hotspot/busy CPUs. This is a multiprocessor statistics tool that reports statistics for each CPU (or core). For more information on $mpstat, see the "How do I spend time in my application compared to kernel time?" section above.
Network bottlenecks can occur even before you saturate other resources on the server. This problem is discovered when running workloads in the client-server model. The first thing you need to do is determine how your network looks. Latency and bandwidth between clients and servers are particularly important. Tools like iperf3, ping, and traceroute are simple tools that can help you determine the limitations of your network. Once the network limitations have been identified, tools like $dstat and $nicstat can help you monitor network utilization and identify any system bottlenecks due to the network.
dstat. This command is used to monitor system resources, including CPU statistics, disk statistics, network statistics, paging statistics, and system statistics. To monitor network utilization, use the -n option.

This command will provide the throughput of packets received and sent by the system.
nicstat. This command prints network interface statistics, including throughput and utilization.

Columns include:
Like networks, disks can also be the reason for poor application performance. When measuring disk performance, we look at the following metrics:
A good rule is that when you select a server/instance for your application, you must first benchmark the disk's I/O performance so that you can get a peak or "upper limit" of disk performance and be able to determine the disk Whether the performance meets the needs of the application. Flexible I/O is an ideal tool for determining these values.
After theAfter the application is running, you can use $iostat and $dstat to monitor disk resource utilization in real time.
iostat command displays I/O statistics for each disk, providing metrics for workload characterization, utilization, and saturation.

The first line output displays a summary of the system, including kernel version, host name, data architecture, and CPU count. The second line shows the CPU summary of the system since startup.
For each disk device displayed in the subsequent row, it displays basic details in the column:
dstat commands are used to monitor system resources, including CPU statistics, disk statistics, network statistics, paging statistics, and system statistics. To monitor disk utilization, use the -d option. This option displays the total number of read (read) and write (writ) operations on disk.
The following image demonstrates write-intensive workloads.

Non-consistent Memory Access (NUMA) is a computer memory design for multiprocessing, where memory access time depends on the memory location relative to the processor. Under NUMA, a processor can access its own local memory faster than non-local memory (local memory of another processor or memory shared between processors). The benefits of NUMA are limited to workloads, especially on servers, where data is often closely related to certain tasks or users.
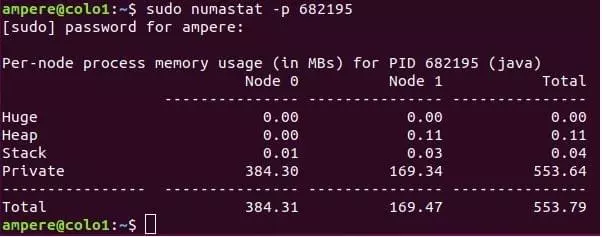
On NUMA systems, the greater the distance between the processor and its memory bank, the slower the processor will access that memory bank. For performance-sensitive applications, the system operating system should allocate memory from the closest memory bank. To monitor the memory allocation of a system or process in real time, $numastat is a great tool.
numastat command provides statistics for non-consistent memory access (NUMA) systems. These systems are usually systems with multiple CPU slots.

The Linux operating system tries to allocate memory on the nearest NUMA node, and $numastat displays current statistics for memory allocation.
Numa_miss and Numa_foreign both show memory allocations not on the preferred NUMA node. Ideally, the values of numa_miss and numa_foreign should be kept to a minimum, as higher values can lead to poor memory I/O performance.
The$numastat -p <process></process> command can also be used to view the NUMA distribution of a process.
When running an application on a system/instance, you will be interested in understanding what the application is doing and the resources the application uses on the CPU. $pidstat is a command line tool that monitors each individual process running on the system.
pidstat The main CPU users will be broken down into user time and system time.
This Linux tool breaks down CPU usage by process or thread, including user time and system time. This command can also report IO statistics for the process (-d option).

$pidstat -p can also be run to collect data about a specific process.

Please contact our expert sales team for partnerships or learn how to access the Ampere system through our Developer Access Program.
The above is the detailed content of 10 Key Questions When Running on Ampere Altra-Based Instances. For more information, please follow other related articles on the PHP Chinese website!


![[Web front-end] Node.js quick start](https://img.php.cn/upload/course/000/000/067/662b5d34ba7c0227.png)


