Home > Web Front-end > CSS Tutorial > CSS Debugging and Optimization: Browser-based Developer Tools

CSS Debugging and Optimization: Browser-based Developer Tools

Lisa Kudrow
Release: 2025-02-10 16:00:14
Original
549 people have browsed it

Mastering CSS: A Guide to Browser-Based Developer Tools for Debugging and Optimization

This excerpt from Tiffany's CSS Master, 2nd Edition, explores essential tools for troubleshooting and optimizing your CSS. Learn how to diagnose rendering problems, enhance performance, and maintain code quality. Effective use of developer tools is key to a high-performing front-end.

Key Takeaways:

  • Chrome, Safari, Firefox, and Edge developer tools are crucial for CSS debugging and optimization. They enable element inspection, problem identification, and performance enhancement.
  • These tools pinpoint cascade/inheritance issues, invalid properties/values, and responsive layout bugs. Mobile emulation allows for cross-device testing.
  • Beyond basic debugging, these tools optimize CSS by identifying redundant code, facilitating real-time style experimentation, and analyzing performance bottlenecks.

Browser-Based Developer Tools: A Deep Dive

Most desktop browsers feature an element inspector. Access it by right-clicking and selecting "Inspect Element" or by pressing Ctrl (Windows/Linux) or Cmd (macOS) while clicking the element. (Alternatively, use the keyboard shortcuts Ctrl Shift I or Cmd Option I).

CSS Debugging and Optimization: Browser-based Developer Tools CSS Debugging and Optimization: Browser-based Developer Tools CSS Debugging and Optimization: Browser-based Developer Tools CSS Debugging and Optimization: Browser-based Developer Tools

Access via menus:

  • Microsoft Edge: Tools > Developer Tools
  • Firefox: Tools > Web Developer
  • Chrome: View > Developer
  • Safari: Develop > Show Web Inspector (Enable in Safari Preferences > Advanced)

After opening, select the appropriate panel (DOM Explorer/Inspector/Elements). The HTML panel displays the DOM (Document Object Model), a browser representation that may differ from the source code. "View Source" shows the original markup.

Utilizing the Styles Panel

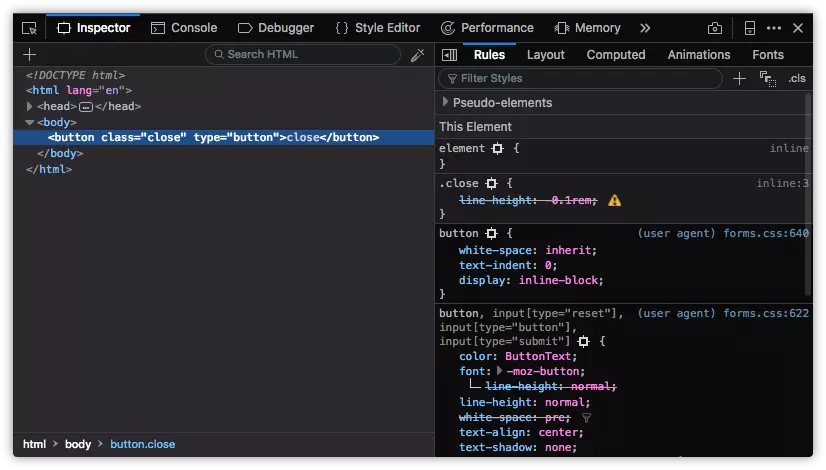
The Styles panel helps diagnose styling discrepancies. Inline styles (from the style attribute) are listed first, followed by author stylesheets (grouped by media query/filename), and finally, user agent styles (browser defaults). Checkboxes toggle rules on/off, and properties/values can be modified in real-time.

Identifying Cascade and Inheritance Problems

Overridden properties are indicated by a strikethrough. This highlights conflicts due to cascading rules, conflicting rules, or more specific selectors.

CSS Debugging and Optimization: Browser-based Developer Tools

Spotting Invalid Properties and Values

Invalid or unsupported properties/values are also strikethrough, often with a warning icon (browser-specific variations exist).

CSS Debugging and Optimization: Browser-based Developer Tools CSS Debugging and Optimization: Browser-based Developer Tools CSS Debugging and Optimization: Browser-based Developer Tools CSS Debugging and Optimization: Browser-based Developer Tools

Debugging Responsive Layouts

All major browsers offer responsive design modes for simulating mobile devices:

  • Chrome: Device toolbar (emulates Android/iOS devices, network throttling, offline simulation). CSS Debugging and Optimization: Browser-based Developer Tools
  • Firefox: Responsive Design Mode (portrait/landscape, touch events, screenshots, network throttling). CSS Debugging and Optimization: Browser-based Developer Tools
  • Microsoft Edge: Emulation tab (Windows mobile devices, geolocation, no network throttling). CSS Debugging and Optimization: Browser-based Developer Tools
  • Safari: Responsive Design Mode (iOS device emulation). CSS Debugging and Optimization: Browser-based Developer Tools

The book continues with advanced debugging techniques, performance tools, and FAQs. For a comprehensive guide, refer to Tiffany's CSS Master, 2nd Edition.

The above is the detailed content of CSS Debugging and Optimization: Browser-based Developer Tools. For more information, please follow other related articles on the PHP Chinese website!

Statement of this Website
The content of this article is voluntarily contributed by netizens, and the copyright belongs to the original author. This site does not assume corresponding legal responsibility. If you find any content suspected of plagiarism or infringement, please contact admin@php.cn
Latest Articles by Author
Popular Tutorials
More>
Latest Downloads
More>
Web Effects
Website Source Code
Website Materials
Front End Template