

Tips and Tricks for Debugging Electron Applications

Electron Application Debugging Guide: Efficiently utilize Chrome Developer Tools and VS Code
This article introduces how to efficiently debug Electron applications, covering the debugging methods of the rendering process and the main process.
Core points
- Electron apps can be debugged directly using Chrome developer tools. It can be accessed through the App menu, shortcut keys, or
BrowserWindow.openDevTools()method. - Main process debugging is relatively complex, and Node Inspector supports are limited. VS Code is recommended, which provides a rich Node application debugging tool.
- VS Code supports custom build tasks and debug configurations, allowing setting breakpoints, checking call stacks, viewing variables, and using a real-time console, making it easier to debug and troubleshoot errors.
Rendering process debugging

Figure 1: Chrome developer tools are used in the rendering process the same as browser applications.
The default menu of the Electron app provides commands to open Chrome Developer Tools. You can also customize the menu and remove this feature.

Figure 2: Developer tools can be switched in the default menu of Electron.
In addition, you can use the Cmd Opt I on macOS or the Ctrl Shift I shortcut keys on Windows/Linux, or programmatically open the developer tools through the BrowserWindow method of the webContents.openDevTools() instance.
app.on('ready', () => {
  mainWindow = new BrowserWindow();
  mainWindow.loadURL(`file://${__dirname}/index.html`);
  mainWindow.webContents.openDevTools();
  mainWindow.on('closed', () => {
    mainWindow = null;
  });
});Code example: Open the developer tool programmatically after the main window is loaded.
Main process debugging
Main process debugging is difficult, and Node Inspector supports are limited. Although the Electron app can be started with the --debug parameter to enable remote debugging (default port 5858), the support for Node Inspector in the official documentation is not fully improved.
Debug the main process using VS Code
VS Code is a free and open source IDE that is also built on Electron. It provides a powerful Node application debugging tool, which is very suitable for debugging Electron applications.
Quickly set up build tasks: Press Ctrl Shift B on Windows, press Cmd Shift B on macOS, and VS Code will prompt you to create a build task (as shown in Figure 3).

Figure 3: If there is no build task, triggering the build task will prompt creation.
You can also press Ctrl Shift P (Windows) or Cmd Shift P (macOS), enter "Task", and select "Select Tasks: Configure Task Runner", which will be created under the .vscode folder A tasks.json file and open it.
The method of setting up build and debugging tasks on each platform is similar, but the name of the prebuilt binary files generated on different operating systems is different: electron-prebuilt on Windows, electron.exe on macOS, Electron.app on Linux. electron
- Set up build tasks in VS Code (tasks.json)
app.on('ready', () => {
  mainWindow = new BrowserWindow();
  mainWindow.loadURL(`file://${__dirname}/index.html`);
  mainWindow.webContents.openDevTools();
  mainWindow.on('closed', () => {
    mainWindow = null;
  });
}); with the corresponding name of your system. <name-of-binary>
on Windows/Linux or Ctrl Shift B on macOS, your Electron app will start. This is not only crucial for setting up debugging in VS Code, but it is also a convenient way to start an application. The next step is to set up VS Code to launch the app and connect to its built-in debugger. Cmd Shift B
Connect to the debugger

To create a startup task, go to the Debug tab in the left panel and click the pinion (Figure 4). VS Code will ask you which type of configuration file you want to create. Select "Node.js" and replace the file contents with the following example configuration.
{
  "version": "0.1.0",
  "command": "node_modules/electron-prebuilt/dist/<name-of-binary>",
  "args": ["lib/main.js"]
} with the corresponding name of your system. <name-of-binary>
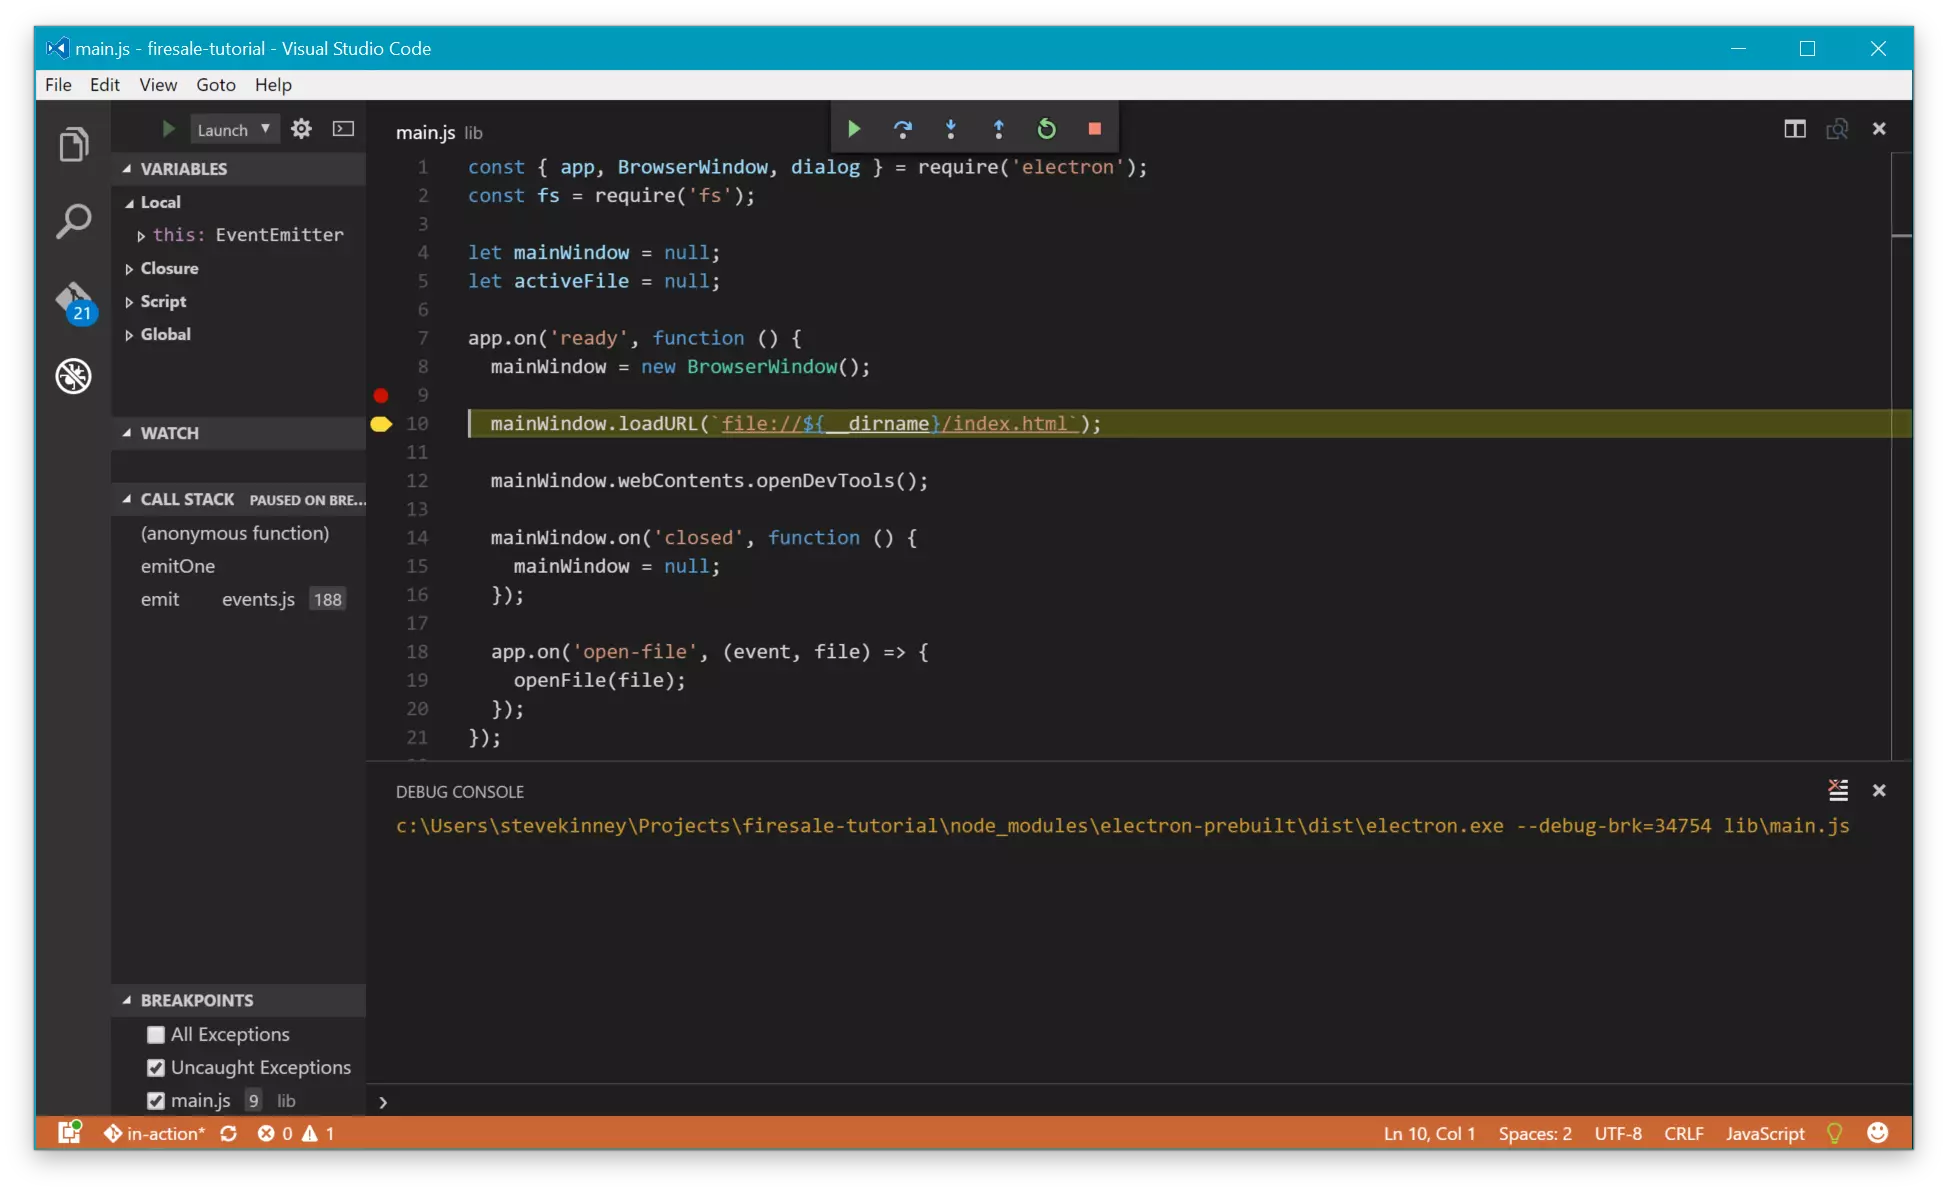
With these two configuration files, you can click on the margin to the left of any row to set a breakpoint, and press
to run the application. Execution pauses at breakpoints, allowing you to check the call stack, view variables within scope, and interact with the real-time console. Breakpoints are not the only way to debug your code. You can also monitor specific expressions, or go into the debugger when an uncaught exception is thrown. F5
Summary
Master these debugging techniques so you can develop and maintain Electron applications more efficiently.
(The FAQs part has been omitted because the original FAQs and the main text are duplicated and the length is long. In order to avoid redundancy, only the introduction of the core debugging methods is retained here.)
The above is the detailed content of Tips and Tricks for Debugging Electron Applications. For more information, please follow other related articles on the PHP Chinese website!

Hot AI Tools

Undresser.AI Undress
AI-powered app for creating realistic nude photos

AI Clothes Remover
Online AI tool for removing clothes from photos.

Undress AI Tool
Undress images for free

Clothoff.io
AI clothes remover

Video Face Swap
Swap faces in any video effortlessly with our completely free AI face swap tool!

Hot Article
Hot Tools

Notepad++7.3.1
Easy-to-use and free code editor

SublimeText3 Chinese version
Chinese version, very easy to use

Zend Studio 13.0.1
Powerful PHP integrated development environment

Dreamweaver CS6
Visual web development tools

SublimeText3 Mac version
God-level code editing software (SublimeText3)
Hot Topics


 What should I do if I encounter garbled code printing for front-end thermal paper receipts?
Apr 04, 2025 pm 02:42 PM
What should I do if I encounter garbled code printing for front-end thermal paper receipts?
Apr 04, 2025 pm 02:42 PM
Frequently Asked Questions and Solutions for Front-end Thermal Paper Ticket Printing In Front-end Development, Ticket Printing is a common requirement. However, many developers are implementing...
 Demystifying JavaScript: What It Does and Why It Matters
Apr 09, 2025 am 12:07 AM
Demystifying JavaScript: What It Does and Why It Matters
Apr 09, 2025 am 12:07 AM
JavaScript is the cornerstone of modern web development, and its main functions include event-driven programming, dynamic content generation and asynchronous programming. 1) Event-driven programming allows web pages to change dynamically according to user operations. 2) Dynamic content generation allows page content to be adjusted according to conditions. 3) Asynchronous programming ensures that the user interface is not blocked. JavaScript is widely used in web interaction, single-page application and server-side development, greatly improving the flexibility of user experience and cross-platform development.
 Who gets paid more Python or JavaScript?
Apr 04, 2025 am 12:09 AM
Who gets paid more Python or JavaScript?
Apr 04, 2025 am 12:09 AM
There is no absolute salary for Python and JavaScript developers, depending on skills and industry needs. 1. Python may be paid more in data science and machine learning. 2. JavaScript has great demand in front-end and full-stack development, and its salary is also considerable. 3. Influencing factors include experience, geographical location, company size and specific skills.
 How to merge array elements with the same ID into one object using JavaScript?
Apr 04, 2025 pm 05:09 PM
How to merge array elements with the same ID into one object using JavaScript?
Apr 04, 2025 pm 05:09 PM
How to merge array elements with the same ID into one object in JavaScript? When processing data, we often encounter the need to have the same ID...
 Is JavaScript hard to learn?
Apr 03, 2025 am 12:20 AM
Is JavaScript hard to learn?
Apr 03, 2025 am 12:20 AM
Learning JavaScript is not difficult, but it is challenging. 1) Understand basic concepts such as variables, data types, functions, etc. 2) Master asynchronous programming and implement it through event loops. 3) Use DOM operations and Promise to handle asynchronous requests. 4) Avoid common mistakes and use debugging techniques. 5) Optimize performance and follow best practices.
 How to achieve parallax scrolling and element animation effects, like Shiseido's official website?
or:
How can we achieve the animation effect accompanied by page scrolling like Shiseido's official website?
Apr 04, 2025 pm 05:36 PM
How to achieve parallax scrolling and element animation effects, like Shiseido's official website?
or:
How can we achieve the animation effect accompanied by page scrolling like Shiseido's official website?
Apr 04, 2025 pm 05:36 PM
Discussion on the realization of parallax scrolling and element animation effects in this article will explore how to achieve similar to Shiseido official website (https://www.shiseido.co.jp/sb/wonderland/)...
 The difference in console.log output result: Why are the two calls different?
Apr 04, 2025 pm 05:12 PM
The difference in console.log output result: Why are the two calls different?
Apr 04, 2025 pm 05:12 PM
In-depth discussion of the root causes of the difference in console.log output. This article will analyze the differences in the output results of console.log function in a piece of code and explain the reasons behind it. �...
 The Evolution of JavaScript: Current Trends and Future Prospects
Apr 10, 2025 am 09:33 AM
The Evolution of JavaScript: Current Trends and Future Prospects
Apr 10, 2025 am 09:33 AM
The latest trends in JavaScript include the rise of TypeScript, the popularity of modern frameworks and libraries, and the application of WebAssembly. Future prospects cover more powerful type systems, the development of server-side JavaScript, the expansion of artificial intelligence and machine learning, and the potential of IoT and edge computing.
