

This article explores the powerful synergy between data science and web development, facilitated by platforms like Shiny and R. The increasing demand for interactive data analysis and cloud-based applications fuels this convergence.

Key Advantages of Shiny and R:
The rising popularity of R in data science necessitates seamless web integration. Shiny acts as a crucial bridge, connecting statisticians and web developers. This tutorial focuses on building a Shiny application, covering UI (user interface) and server-side aspects. Prior R knowledge is beneficial but not mandatory. We'll construct a simple statistical graph and demonstrate basic HTML customization.
Setting Up Your Shiny App:
First, install RStudio. Create a new Shiny Web App by selecting "New File" then "Shiny Web App...".

Name your application (e.g., "OurFirstApp") and choose "Multiple File (ui.R/server.R)". (Using separate ui.R and server.R files keeps the code organized.) Shinyapps.io offers online deployment and remote control via the rsconnect package (details beyond this tutorial's scope).
Building the Application:
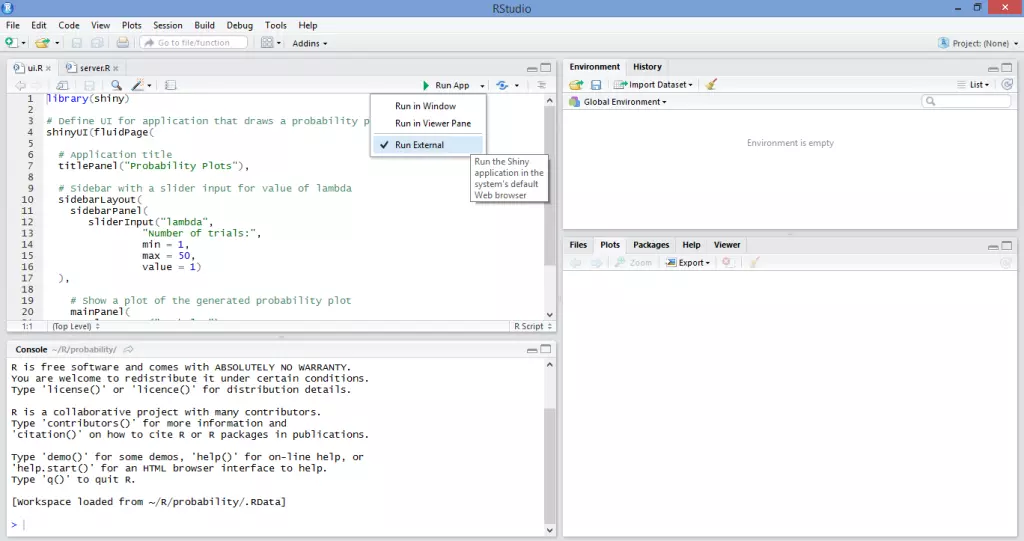
Our application will display a line graph showing the probability of occurrence based on the number of trials (N). A slider will control N (1-50). This demonstrates reactivity: the graph updates instantly with slider changes.
ui.R:
library(shiny)

shinyUI(fluidPage(
  titlePanel("Probability Plots"),
  sidebarLayout(
    sidebarPanel(
      sliderInput("lambda", "Number of trials:", min = 1, max = 50, value = 1)
    ),
    mainPanel(plotOutput("ProbPlot"))
  )
))server.R:
library(shiny)
library(ggplot2)
library(scales)

shinyServer(function(input, output) {
  output$ProbPlot <- renderPlot({
    n <- 1:100
    lambda <- input$lambda
    # ... (probability calculation and plotting code using ggplot2) ...
  })
})(Note: The ggplot2 and scales libraries are included for more advanced graphing capabilities, though not strictly necessary for this basic example. The probability calculation and plotting code using ggplot2 would be added here.)
Running the Application:
Select "Run App" from the "Run External" option in RStudio. The application will launch in your web browser. The slider controls N, and the graph updates dynamically. This illustrates reactive expressions – automatic updates based on user input.


HTML Customization:
Modify ui.R to incorporate HTML for UI enhancements. This example changes headings' font and color:
Modified ui.R:
library(shiny)

shinyUI(fluidPage(
  titlePanel("Probability Plots"),
  sidebarLayout(
    sidebarPanel(
      sliderInput("lambda", "Number of trials:", min = 1, max = 50, value = 1)
    ),
    mainPanel(plotOutput("ProbPlot"))
  )
))Running this updated code produces a visually enhanced application. (Further HTML customization is possible.)

Conclusion:
This tutorial provides a foundation for Shiny app development. Shiny's capabilities extend far beyond this basic example, including JavaScript integration for advanced UI features. This introduction serves as a starting point for exploring Shiny's potential in merging data science and web development.
The above is the detailed content of Shiny, R and HTML: Merging Data Science and Web Development. For more information, please follow other related articles on the PHP Chinese website!


![[Web front-end] Node.js quick start](https://img.php.cn/upload/course/000/000/067/662b5d34ba7c0227.png)


