

Making your own Gantt chart with Webix


Key Takeaways
- The Webix framework can be used in combination with the open-source JavaScript Gantt chart dhtmlxGantt to create a custom Gantt chart application. This combination allows for the visualization of a project’s working process and offers features such as export and customizable time scale.
- The creation of a basic Gantt chart involves downloading the dhtmlxGantt library package and extracting the “codebase” folder to the project directory. The chart can then be initialized with data, including tasks and links, represented as JavaScript objects.
- Webix UI components can be used to add further control to the Gantt chart. For example, a menu button can be added to allow for the export of the chart into different file formats, and a toolbar can be included to allow for the changing of the chart’s scale.
- The final product is a lightweight online chart creation tool, which has the potential for extensive functionality. The source code and a demo of the chart can be found on GitHub.
In my previous article, I’ve introduced you the Webix Framework. You’ve discovered its basic features and learned how to create a very good-looking responsive web application with it. Now it’s time to take a little step forward and see what else we can do with this promising framework.
In this article, I’ll show you how to create your own Gantt chart application and to complete this task I’ll use the Webix framework in combination with an open source JavaScript Gantt chart called dhtmlxGantt.
But why the Gantt chart, you might ask. Well, undoubtedly it has many pros. Firstly, these charts are widely used to visualize the working process of a project due to their intuitive way of representation. Secondly, dhtmlxGantt is a Gantt chart tool which has a big list of features such as export, customizable time scale, and so on. Finally, I found a post titled DHTMLX Gantt Chart in Webix Web Apps in the Webix developer’s blog and it turned out that you can add a Gantt chart into a Webix application with just few lines of code. So, I thought that they could fit well together.
If you might need help, a bunch of step-by-step guides are available as well, so feel free to use them if in doubt.
Creating a Basic Gantt Chart
Let’s now create our application. First, we’ll take a look at a basic chart. Then, we’ll add some features to increase its functionality.
Preparing the Files
First of all, we need to download the dhtmlxGantt library package and extract the “codebase” folder to the project directory. Since the ntegration with dhtmlxGantt isn’t a built-in Webix feature, we need to download required files from this GitHub repository. We are interested in is the “gantt” directory that you should place into your project directory.
I’ve used the Webix CDN to include Webix to my project, but you can download the full library if you want. Moreover, we need the api.js file which will allow us to use the export feature.
So, here’s my index.html file at the moment:
<span><span><span><head</span>></span>
</span>   <span><span><span><title</span>></span>Webix Gantt Chart<span><span></title</span>></span>
</span>   <span><!--Webix-->
</span>   <span><span><span><script</span> src<span>="http://cdn.webix.com/edge/webix.js"</span>></span><span><span></script</span>></span>
</span>   <span><span><span><link</span> rel<span>="stylesheet"</span> href<span>="http://cdn.webix.com/edge/webix.css"</span> /></span>
</span>   <span><!--dhtmlxGantt-->
</span>   <span><span><span><script</span> src<span>="codebase/dhtmlxgantt.js"</span>></span><span><span></script</span>></span>
</span>   <span><span><span><link</span> href<span>="codebase/dhtmlxgantt.css"</span> rel<span>="stylesheet"</span> /></span>
</span>   <span><!--dhtmlxGantt integration-->
</span>   <span><span><span><script</span> type<span>="text/javascript"</span> src<span>="./gantt/gantt.js"</span>></span><span><span></script</span>></span>
</span>   <span><!--export-->
</span>   <span><span><span><script</span> src<span>="http://export.dhtmlx.com/gantt/api.js"</span>></span><span><span></script</span>></span>
</span><span><span><span></head</span>></span></span>
Once done, we can create a basic Gantt chart.
Gantt Chart Initialization
This chart offers the possibility to use a database to store the data (you can check the documentation page to see how it works). However, for our experiment we’ll use inline data as an example to focus on the JavaScript part. n this tutorial I’ll pretend the use of the second one whose content has also been converted into its equivalent JavaScript object:
<span>var tasks = {
</span>   <span>data: [{
</span>         <span>id: 1,
</span>         <span>text: "Project #1",
</span>         <span>start_date: "01-06-2015",
</span>         <span>duration: 11,
</span>         <span>progress: 0.6,
</span>         <span>open: true
</span>      <span>}, {
</span>         <span>id: 2,
</span>         <span>text: "Task #1",
</span>         <span>start_date: "03-06-2015",
</span>         <span>duration: 5,
</span>         <span>progress: 1,
</span>         <span>open: true,
</span>         <span>parent: 1
</span>      <span>},
</span>      <span>/*some more tasks*/
</span>      <span>{
</span>         <span>id: 6,
</span>         <span>text: "Task #2.3",
</span>         <span>start_date: "05-06-2015",
</span>         <span>duration: 4,
</span>         <span>progress: 0.2,
</span>         <span>open: true,
</span>         <span>parent: 3
</span>      <span>}
</span>   <span>],
</span>   <span>links: [{
</span>         <span>id: 1,
</span>         <span>source: 1,
</span>         <span>target: 2,
</span>         <span>type: "1"
</span>      <span>}, {
</span>         <span>id: 2,
</span>         <span>source: 1,
</span>         <span>target: 3,
</span>         <span>type: "1"
</span>      <span>},
</span>      <span>/*some more links*/
</span>      <span>{
</span>         <span>id: 5,
</span>         <span>source: 5,
</span>         <span>target: 6,
</span>         <span>type: "0"
</span>      <span>}
</span>   <span>]
</span><span>};</span>Let’s discuss the properties. The dataproperty contains the tasks description: the task name, its ID, its starting date, the task duration presented in the units of the current time scale (days by default), and the current progress (a number ranging from 0 to 1). It also includes the open property which defines whether the task branch is open or not, and the parent property, whose aim is to define the parent task. The links parameter defines dependency links and it consists of the following values: the task ID, the source task that depends on the target one and, the dependency type (0 – ‘finish to start’, 1 – ‘start to start’, 2 – ‘finish to finish’).
We can now initialize our chart with this data:
webix<span>.ui({
</span>   <span>rows: [
</span>      <span>//row_1: header
</span>      <span>{
</span>         <span>type: "header",
</span>         <span>template: "Webix Gantt Chart"
</span>      <span>},
</span>      <span>//row_2: gantt chart
</span>      <span>{
</span>         <span>view: "dhx-gantt",
</span>         <span>init: function() {
</span>            gantt<span>.config.order_branch = true;
</span>         <span>},
</span>         <span>ready: function() {
</span>            gantt<span>.parse(tasks);
</span>         <span>}
</span>      <span>}
</span>   <span>]
</span><span>});</span>The view:"dhx-gantt" defines a UI component type, Gantt chart in this case. The init property contains the function which will run before the initialization. I’ve used the order_branch option to enable drag-and-drop tasks reordering. The ready property defines the function which is triggered when the component is fully loaded. In our case, it initializes the chart with previously created data using the gantt.parse() method.
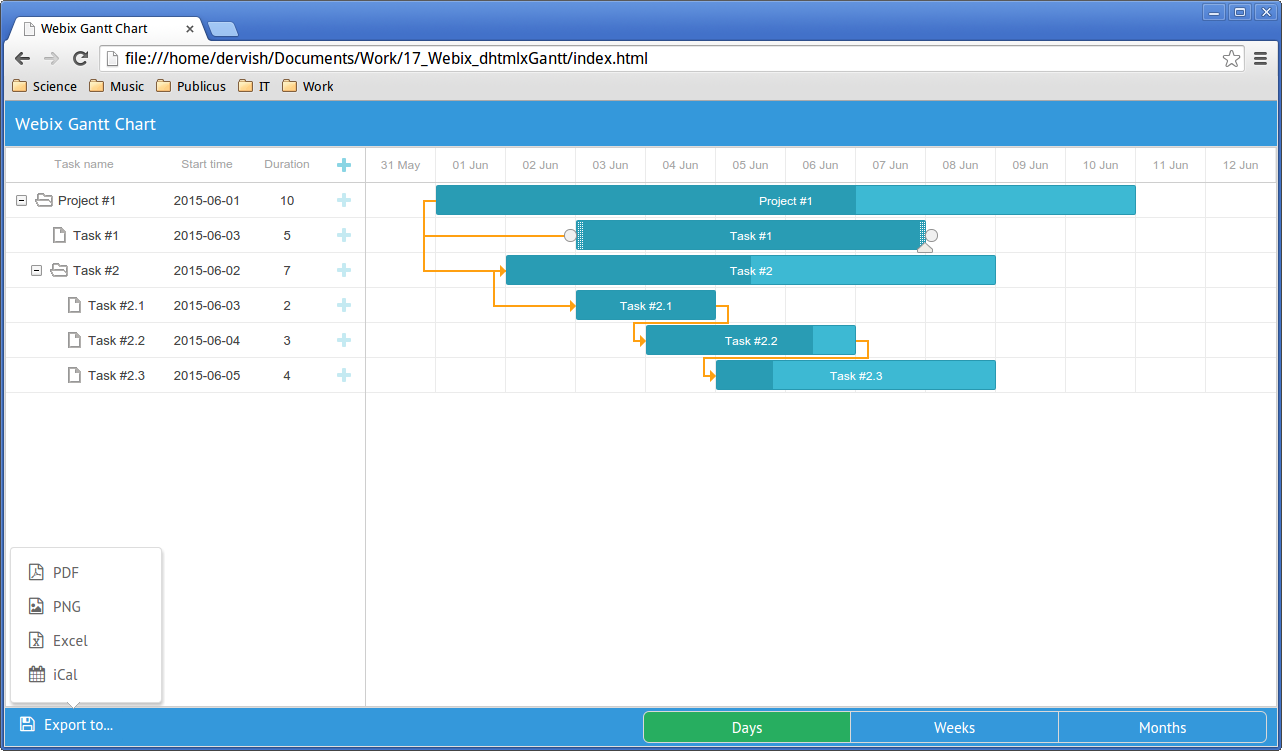
The result is shown below:
So, which features do we have? You can redefine the existing task dependencies and create new ones. You can do it by dragging circles at the edges of the tasks. The progress status can be changed with the triangle at the bottom. The start time of a task can be changed by means of dragging a task in the horizontal direction. As for duration, you can set it by resizing the task. We can add new tasks and subtasks using the “ ” buttons.
Here’s how a new task creation looks like:

At this point we can create a chart, but there are no ways to manipulate it. So, let’s add some controls for this purpose.
More Control with Webix
We’ll use some of the Webix UI components to control our chart.
“Export to…” Menu Button
To avoid messy code, I’ve decided to separate the UI components initialization from the layout code.
Firstly, let’s define the menu button, which will allow us to export our chart into different file formats. For this purpose, we’ll use the Webix Menu component.
Here’s the menu description:
<span><span><span><head</span>></span>
</span>   <span><span><span><title</span>></span>Webix Gantt Chart<span><span></title</span>></span>
</span>   <span><!--Webix-->
</span>   <span><span><span><script</span> src<span>="http://cdn.webix.com/edge/webix.js"</span>></span><span><span></script</span>></span>
</span>   <span><span><span><link</span> rel<span>="stylesheet"</span> href<span>="http://cdn.webix.com/edge/webix.css"</span> /></span>
</span>   <span><!--dhtmlxGantt-->
</span>   <span><span><span><script</span> src<span>="codebase/dhtmlxgantt.js"</span>></span><span><span></script</span>></span>
</span>   <span><span><span><link</span> href<span>="codebase/dhtmlxgantt.css"</span> rel<span>="stylesheet"</span> /></span>
</span>   <span><!--dhtmlxGantt integration-->
</span>   <span><span><span><script</span> type<span>="text/javascript"</span> src<span>="./gantt/gantt.js"</span>></span><span><span></script</span>></span>
</span>   <span><!--export-->
</span>   <span><span><span><script</span> src<span>="http://export.dhtmlx.com/gantt/api.js"</span>></span><span><span></script</span>></span>
</span><span><span><span></head</span>></span></span>
By default, the menu button is activated when the mouse hovers over it. The openAction: "click" property redefines this behavior, so the menu will open its submenus by the mouse click only. The data parameter defines the menu content. What’s interesting here is the type: "icon" property which allows us to add an icon to the menu button. Webix uses Font Awesome icons collection. If you want to apply the icon you like, you have to use the icon’s name as the value of the icon parameter.
The next step is the event handling. The onItemClick event fires when one of the menu items is clicked. I’ve used the switch statement to handle the selected id value, so you can see what method is used for a certain file format. The submenu parameter contains the menu items definition.
Toolbar
We’ll place our toolbar at the bottom of the page. It’ll contain the control elements including our menu button.
The Toolbar component will help us with that. But before, let’s define which options we should add. If you want to manage a project the duration of which is long enough, you should think about the scale changing feature. dhtmlxGantt provides you with a wide variety of available scale properties. We’ll use Day, Week, and Month scales.
Let’s define the function that will enable the month scale:
<span>var tasks = {
</span>   <span>data: [{
</span>         <span>id: 1,
</span>         <span>text: "Project #1",
</span>         <span>start_date: "01-06-2015",
</span>         <span>duration: 11,
</span>         <span>progress: 0.6,
</span>         <span>open: true
</span>      <span>}, {
</span>         <span>id: 2,
</span>         <span>text: "Task #1",
</span>         <span>start_date: "03-06-2015",
</span>         <span>duration: 5,
</span>         <span>progress: 1,
</span>         <span>open: true,
</span>         <span>parent: 1
</span>      <span>},
</span>      <span>/*some more tasks*/
</span>      <span>{
</span>         <span>id: 6,
</span>         <span>text: "Task #2.3",
</span>         <span>start_date: "05-06-2015",
</span>         <span>duration: 4,
</span>         <span>progress: 0.2,
</span>         <span>open: true,
</span>         <span>parent: 3
</span>      <span>}
</span>   <span>],
</span>   <span>links: [{
</span>         <span>id: 1,
</span>         <span>source: 1,
</span>         <span>target: 2,
</span>         <span>type: "1"
</span>      <span>}, {
</span>         <span>id: 2,
</span>         <span>source: 1,
</span>         <span>target: 3,
</span>         <span>type: "1"
</span>      <span>},
</span>      <span>/*some more links*/
</span>      <span>{
</span>         <span>id: 5,
</span>         <span>source: 5,
</span>         <span>target: 6,
</span>         <span>type: "0"
</span>      <span>}
</span>   <span>]
</span><span>};</span>The scale_unit property defines the scale unit. Its possible values are “minute”, “hour”, “day”, “week”, “quarter”, “month”, and “year”. To set a proper format of the time scale we’ve used the date_scale property. After that we should refresh the chart with gantt.parse(tasks).
Here’s how our chart looks like after we’ve used this function:

Other scale functions work pretty in a similar fashion, so I won’t describe them.
Now we can define the toolbar variable:
<span><span><span><head</span>></span>
</span>   <span><span><span><title</span>></span>Webix Gantt Chart<span><span></title</span>></span>
</span>   <span><!--Webix-->
</span>   <span><span><span><script</span> src<span>="http://cdn.webix.com/edge/webix.js"</span>></span><span><span></script</span>></span>
</span>   <span><span><span><link</span> rel<span>="stylesheet"</span> href<span>="http://cdn.webix.com/edge/webix.css"</span> /></span>
</span>   <span><!--dhtmlxGantt-->
</span>   <span><span><span><script</span> src<span>="codebase/dhtmlxgantt.js"</span>></span><span><span></script</span>></span>
</span>   <span><span><span><link</span> href<span>="codebase/dhtmlxgantt.css"</span> rel<span>="stylesheet"</span> /></span>
</span>   <span><!--dhtmlxGantt integration-->
</span>   <span><span><span><script</span> type<span>="text/javascript"</span> src<span>="./gantt/gantt.js"</span>></span><span><span></script</span>></span>
</span>   <span><!--export-->
</span>   <span><span><span><script</span> src<span>="http://export.dhtmlx.com/gantt/api.js"</span>></span><span><span></script</span>></span>
</span><span><span><span></head</span>></span></span>
It looks similar to our previously created menu. The paddingY property sets the top and bottom padding values to 0. The elements property defines the toolbar content, just as the data property in our menu example. Toolbar’s first element is our menu while the second one is a Segmented Button. It’s useful when you want to switch between the available values like the scale units in our example. One more event handler was used to manage the user’s choice, but this time it’s the onChange event. It fires after the currently selected button is changed. Our previously defined functions will change the scale according to the selected button ID. The option property defines the buttons (segments) within the control.
Finally, it’s time to add the toolbar to our chart. To do this, just add the toolbar variable to your layout code:
<span>var tasks = {
</span>   <span>data: [{
</span>         <span>id: 1,
</span>         <span>text: "Project #1",
</span>         <span>start_date: "01-06-2015",
</span>         <span>duration: 11,
</span>         <span>progress: 0.6,
</span>         <span>open: true
</span>      <span>}, {
</span>         <span>id: 2,
</span>         <span>text: "Task #1",
</span>         <span>start_date: "03-06-2015",
</span>         <span>duration: 5,
</span>         <span>progress: 1,
</span>         <span>open: true,
</span>         <span>parent: 1
</span>      <span>},
</span>      <span>/*some more tasks*/
</span>      <span>{
</span>         <span>id: 6,
</span>         <span>text: "Task #2.3",
</span>         <span>start_date: "05-06-2015",
</span>         <span>duration: 4,
</span>         <span>progress: 0.2,
</span>         <span>open: true,
</span>         <span>parent: 3
</span>      <span>}
</span>   <span>],
</span>   <span>links: [{
</span>         <span>id: 1,
</span>         <span>source: 1,
</span>         <span>target: 2,
</span>         <span>type: "1"
</span>      <span>}, {
</span>         <span>id: 2,
</span>         <span>source: 1,
</span>         <span>target: 3,
</span>         <span>type: "1"
</span>      <span>},
</span>      <span>/*some more links*/
</span>      <span>{
</span>         <span>id: 5,
</span>         <span>source: 5,
</span>         <span>target: 6,
</span>         <span>type: "0"
</span>      <span>}
</span>   <span>]
</span><span>};</span>Here’s the result:
Our chart is scalable now. Menu icons will help a user to make his choice.
Conclusions
In this article we’ve seen how to build a dhtmlxGantt based Gantt chart app, set a proper scale according to its overall duration, and export it to a file for further needs. What we’ve got is a lightweight online chart creation tool.
There are just a couple of articles about the integration of Webix with dhtmlxGantt at the moment. However, according to this post titled Use case of Webix UI – Gantt PRO, recently Webix has been used to create GanttPRO – an advanced online Gantt chart app. This makes me guess that, by using the features and UI components described in the post, you’ll be able to considerably extend Gantt chart functionality.
If you want to check out the source code and a demo, you can visit this GitHub page.
Frequently Asked Questions (FAQs) about Creating Your Own Gantt Chart with Webix
How can I customize the appearance of my Gantt chart in Webix?
Webix provides a variety of customization options for your Gantt chart. You can change the color, size, and style of the bars, text, and grid lines. You can also add labels, tooltips, and legends. To customize the appearance, you need to modify the properties of the Gantt chart object in your JavaScript code. For example, to change the color of the bars, you can use the ‘color’ property. You can also use CSS to further customize the appearance of your Gantt chart.
Can I add dependencies between tasks in my Gantt chart?
Yes, you can add dependencies between tasks in your Gantt chart in Webix. Dependencies are represented by lines connecting the bars of the tasks. To add a dependency, you need to specify the ‘depends_on’ property for a task in your data. The value of this property should be the id of the task that it depends on. This will automatically draw a line from the dependent task to the task it depends on.
How can I handle large amounts of data in my Gantt chart?
Webix provides several features to handle large amounts of data in your Gantt chart. You can use the ‘paging’ feature to divide your data into pages. This allows you to display a manageable amount of data at a time. You can also use the ‘filtering’ feature to display only the data that meets certain criteria. This can be useful if you want to focus on specific tasks.
Can I export my Gantt chart to a PDF or image file?
Yes, you can export your Gantt chart to a PDF or image file in Webix. This can be useful if you want to share your chart with others or include it in a report. To export your chart, you need to use the ‘exportToPDF’ or ‘exportToPNG’ method of the Gantt chart object. This will generate a PDF or PNG file of your chart that you can download.
How can I add interactivity to my Gantt chart?
Webix provides several features to add interactivity to your Gantt chart. You can add event listeners to respond to user actions such as clicking or dragging a bar. You can also use the ‘editable’ property to allow users to edit the tasks directly in the chart. This can be useful if you want to allow users to update the progress of tasks.
Can I use Webix to create a Gantt chart in a mobile app?
Yes, you can use Webix to create a Gantt chart in a mobile app. Webix is a JavaScript library, so it can be used in any platform that supports JavaScript. This includes mobile platforms such as iOS and Android. The Gantt chart will automatically adapt to the screen size of the device.
How can I add milestones to my Gantt chart?
You can add milestones to your Gantt chart in Webix by creating tasks with a duration of zero. These tasks will be displayed as diamonds in the chart. To create a milestone, you need to specify the ‘start_date’ and ‘end_date’ properties of a task to be the same. This will create a task with a duration of zero, which will be displayed as a milestone.
Can I use Webix to create a Gantt chart with multiple timelines?
Yes, you can use Webix to create a Gantt chart with multiple timelines. This can be useful if you want to display different levels of detail or different aspects of your project. To create multiple timelines, you need to use the ‘subtasks’ property of a task. This allows you to create a hierarchy of tasks, each with its own timeline.
How can I add resources to my Gantt chart?
You can add resources to your Gantt chart in Webix by creating tasks with a ‘resource’ property. This property should be an object that contains the details of the resource, such as its name and capacity. The resource will be displayed in the chart as a label next to the task.
Can I use Webix to create a Gantt chart in a web application?
Yes, you can use Webix to create a Gantt chart in a web application. Webix is a JavaScript library, so it can be used in any platform that supports JavaScript. This includes web platforms such as HTML5 and CSS3. The Gantt chart will automatically adapt to the screen size of the device.
The above is the detailed content of Making your own Gantt chart with Webix. For more information, please follow other related articles on the PHP Chinese website!

Hot AI Tools

Undresser.AI Undress
AI-powered app for creating realistic nude photos

AI Clothes Remover
Online AI tool for removing clothes from photos.

Undress AI Tool
Undress images for free

Clothoff.io
AI clothes remover

AI Hentai Generator
Generate AI Hentai for free.

Hot Article
Hot Tools

Notepad++7.3.1
Easy-to-use and free code editor

SublimeText3 Chinese version
Chinese version, very easy to use

Zend Studio 13.0.1
Powerful PHP integrated development environment

Dreamweaver CS6
Visual web development tools

SublimeText3 Mac version
God-level code editing software (SublimeText3)
Hot Topics
 1377
1377
 52
52

 How do I create and publish my own JavaScript libraries?
Mar 18, 2025 pm 03:12 PM
How do I create and publish my own JavaScript libraries?
Mar 18, 2025 pm 03:12 PM
Article discusses creating, publishing, and maintaining JavaScript libraries, focusing on planning, development, testing, documentation, and promotion strategies.
 How do I optimize JavaScript code for performance in the browser?
Mar 18, 2025 pm 03:14 PM
How do I optimize JavaScript code for performance in the browser?
Mar 18, 2025 pm 03:14 PM
The article discusses strategies for optimizing JavaScript performance in browsers, focusing on reducing execution time and minimizing impact on page load speed.
 What should I do if I encounter garbled code printing for front-end thermal paper receipts?
Apr 04, 2025 pm 02:42 PM
What should I do if I encounter garbled code printing for front-end thermal paper receipts?
Apr 04, 2025 pm 02:42 PM
Frequently Asked Questions and Solutions for Front-end Thermal Paper Ticket Printing In Front-end Development, Ticket Printing is a common requirement. However, many developers are implementing...
 How do I debug JavaScript code effectively using browser developer tools?
Mar 18, 2025 pm 03:16 PM
How do I debug JavaScript code effectively using browser developer tools?
Mar 18, 2025 pm 03:16 PM
The article discusses effective JavaScript debugging using browser developer tools, focusing on setting breakpoints, using the console, and analyzing performance.
 How do I use source maps to debug minified JavaScript code?
Mar 18, 2025 pm 03:17 PM
How do I use source maps to debug minified JavaScript code?
Mar 18, 2025 pm 03:17 PM
The article explains how to use source maps to debug minified JavaScript by mapping it back to the original code. It discusses enabling source maps, setting breakpoints, and using tools like Chrome DevTools and Webpack.
 Getting Started With Chart.js: Pie, Doughnut, and Bubble Charts
Mar 15, 2025 am 09:19 AM
Getting Started With Chart.js: Pie, Doughnut, and Bubble Charts
Mar 15, 2025 am 09:19 AM
This tutorial will explain how to create pie, ring, and bubble charts using Chart.js. Previously, we have learned four chart types of Chart.js: line chart and bar chart (tutorial 2), as well as radar chart and polar region chart (tutorial 3). Create pie and ring charts Pie charts and ring charts are ideal for showing the proportions of a whole that is divided into different parts. For example, a pie chart can be used to show the percentage of male lions, female lions and young lions in a safari, or the percentage of votes that different candidates receive in the election. Pie charts are only suitable for comparing single parameters or datasets. It should be noted that the pie chart cannot draw entities with zero value because the angle of the fan in the pie chart depends on the numerical size of the data point. This means any entity with zero proportion
 Who gets paid more Python or JavaScript?
Apr 04, 2025 am 12:09 AM
Who gets paid more Python or JavaScript?
Apr 04, 2025 am 12:09 AM
There is no absolute salary for Python and JavaScript developers, depending on skills and industry needs. 1. Python may be paid more in data science and machine learning. 2. JavaScript has great demand in front-end and full-stack development, and its salary is also considerable. 3. Influencing factors include experience, geographical location, company size and specific skills.
 TypeScript for Beginners, Part 2: Basic Data Types
Mar 19, 2025 am 09:10 AM
TypeScript for Beginners, Part 2: Basic Data Types
Mar 19, 2025 am 09:10 AM
Once you have mastered the entry-level TypeScript tutorial, you should be able to write your own code in an IDE that supports TypeScript and compile it into JavaScript. This tutorial will dive into various data types in TypeScript. JavaScript has seven data types: Null, Undefined, Boolean, Number, String, Symbol (introduced by ES6) and Object. TypeScript defines more types on this basis, and this tutorial will cover all of them in detail. Null data type Like JavaScript, null in TypeScript
