

Technical Analysis Teaching Guide: Judge Price Behavior through K-line

Catalog
-
Introduction
-
(I) Learning Path
-
(II) Key elements of type trading
-
1. Interpretation of K-line price behavior
-
(I) Basic concepts
-
(II) Analysis Tool
-
2. Analysis of K-line price behavior: weighing pros and cons
-
- Advantages
-
- Disadvantages
-
3. K-line pattern interpretation skills
-
- K-line strength and weakness determination
-
- Strong Trend Identification
-
- Research and judgment of reversal signal
-
4. The driving force of price fluctuations: Trend analysis
-
- Trend definition
-
- Trendline drawing and application
-
- Coping strategies after the trend line breaks
-
- Summary of trend analysis
-
5. K-line support and pressure levels
-
- Key Price Identification
-
- Test and conversion of support pressure levels
-
Conclusion
Introduction
Traditional type analysis, also known as traditional chart analysis, is a technical analysis method based on K-line price behavior. By summarizing specific price patterns and subsequent trends in historical markets, identifying specific patterns, so as to quickly screen trading opportunities and predict market trends. This article avoids using too many professional terms and strives to help readers establish a technical analysis system based on basic principles.
(I) Learning Path
-
Price Analysis: K-line strength → trend → support pressure → pattern;
-
Model analysis:Model introduction →Identification and entry strategy →Model trading strengthening.
(II) Key elements of type trading
-
Strict risk control and a stable mentality are the cornerstones of success.
-
Remember that the pattern comes from the price. You should first understand the "price", then summarize the "form", and finally deduce the "trend".
-
The shape and effectiveness of different time zones are different. It is necessary to combine the price range and trend of the large-level level, and judge the entry opportunity and profit-loss ratio at a small level.
-
Consensus is crucial, and the effect of superposition of morphology or combination of multiple technical indicators is better than that of a single morphology. Maybe you still find it difficult to fully understand the points mentioned in the article, but please remember them and experience them carefully in the future.
1. Interpretation of K-line price behavior
Price behavior is the core of traditional pattern analysis, but it is not the only focus of this article. The following outlines the concepts, tools and advantages and disadvantages of price behavior analysis.
(I) Basic concepts
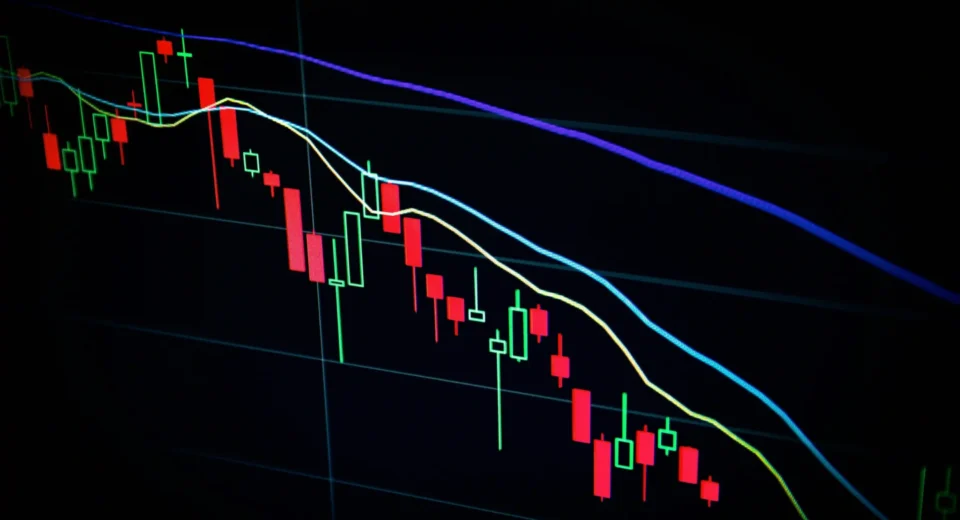
Price Action Analysis (PA) is a technical analysis method that directly observes changes in market prices and trading volume to predict future trends. Price fluctuations are derived from the behavior of market participants, which are reflected through price patterns and trading volume.
(II) Analysis Tool
-
K-line (Candlesticks): Each K-line reflects the opening price, closing price, highest price and lowest price over a period of time. By observing the K-line arrangement, we can judge the strength and pattern of the trend over a period of time.
-
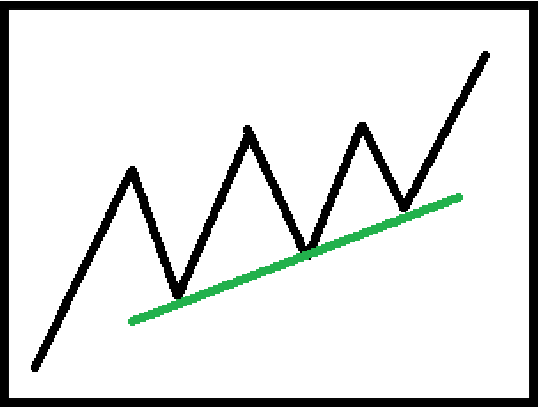
Trendline: A line connecting the high or low points of the price to identify the convergence, expansion or oscillation of the price, as well as the relative strength of the high and low trends.
-
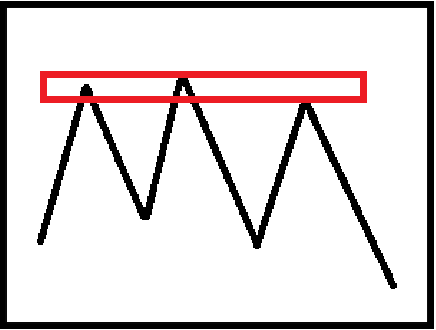
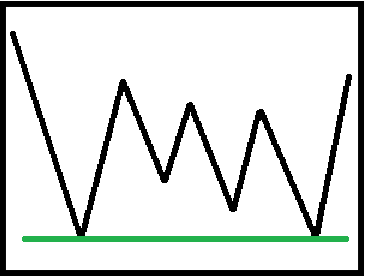
Support & Resistance: Support is the position where the price is supported when it falls, and pressure is the position where the price is blocked when it rises. Interpret the market by observing the price strength when these prices are touched or broken through.
-
Patterns: The focus of this article is to combine the above tools to identify specific price patterns to predict future trends. Common forms and applications will be introduced later.
2. Analysis of K-line price behavior: weighing pros and cons
1. Advantages
- Easy to get started: no complex theoretical foundation is required, just start from the K-line and price, and choose a strong direction to intervene according to strength and weakness.
- High reliability: Price behavior is based on the collective choice of market participants and capital, and capital advantagers often dominate the trend.
- High expected returns: Understand the market start position and follow the trend of capital advantage, and the expected returns (Expected Value, EV) are higher.
2. Disadvantages
- Main manipulation: The main force also understands the trend principle and may use manipulation of stop loss to establish a price advantage.
- Difficult to master: a single analysis method may lead to slow judgment, require accumulating a lot of experience, and use multiple filtering methods to deal with market traps.
3. K-line pattern interpretation skills
1. K-line strength and weakness determination
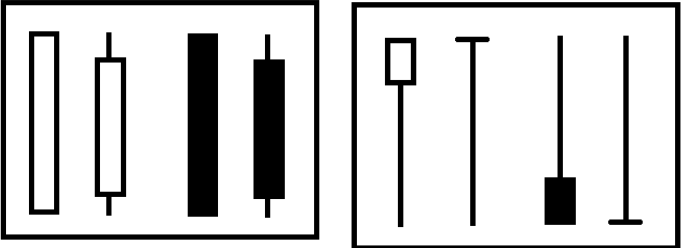
K-line consists of the opening price, the highest price, the lowest price and the closing price. The closing price is higher than the opening price and is the positive line (white), and vice versa. The part of the highest and lowest price exceeding the opening and closing price is a shadow line, and the part between the opening and closing price is an entity. Each K-line contains price and fluctuation information for this period.

The following is only a few more obvious examples, and actual judgments need to be combined with subsequent trends and overall trends.
2. Recognition of strong trends
Strong K-lines are usually full, or full of solid and have very short shadows (above), or have strong closing characteristics, such as long lower shadows in upward trends and long upper shadows in downward trends (above).
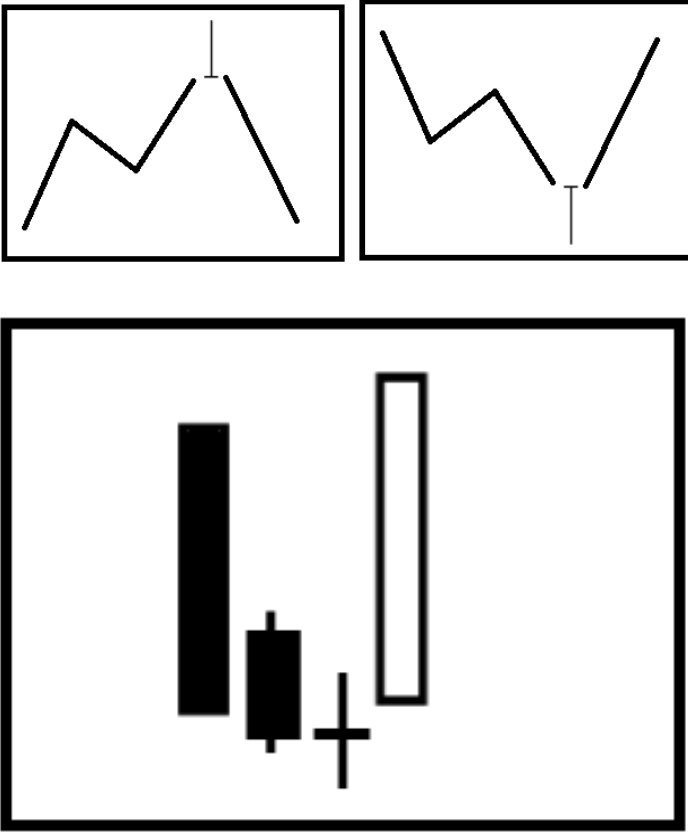
3. Reversal signal
The long upper shadow appears in the band high point (above), the long lower shadow appears in the band low point (above), or the obvious pherophytic pattern appears (stop after the decline and is completely covered by a stronger K-line, as shown in the figure below), etc., which may be a reversal signal.
4. The driving force of price fluctuations: Trend analysis
1. Trend definition
Trend refers to the direction of prices over a period of time, determined by the competition of supply and demand forces, and can be divided into upward, downward or horizontal trends.
Attack trend: Prices continue to rise, usually dominated by the buyer.

Downward trend: Prices continue to fall, usually dominated by the seller.

Horizontal Trend: Prices are maintained within a specific range, usually caused by the balance of long and short forces.

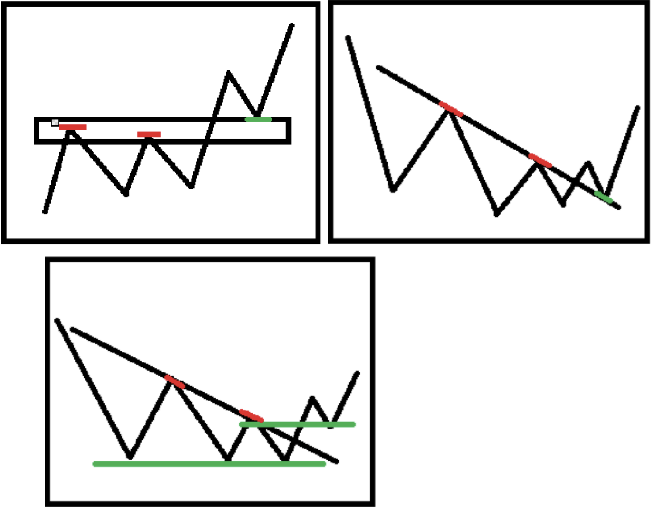
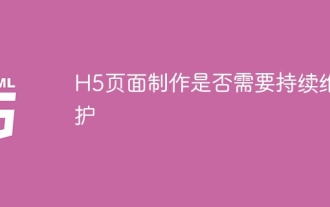
2. Trend line drawing and application
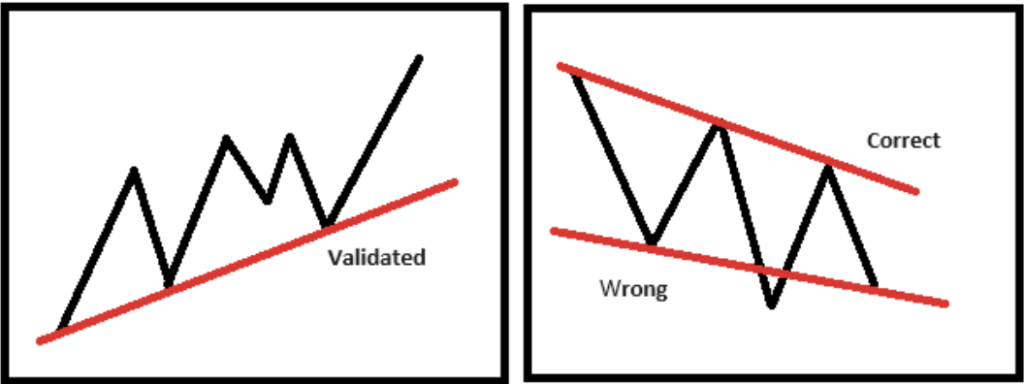
Trend lines connect price highs or lows to judge trends. An effective trend line must pass at least three points. The higher the level, the more effective it is, and try to cover the complete price changes.
3. Coping strategies after the trend line breaks
- Retracement after breakthrough: It is necessary to combine the judgment of the strength and weakness of the K-line and follow-up trend to determine whether it is a false breakthrough or a trend reversal.
- Entity Breakthrough: It is usually regarded as a trend line failure or a trend level/amplitude expansion. It is necessary to operate with caution and consider reducing positions or moving stop loss.
4. Summary of trend analysis
All analytical tools and methods are designed to assist in identifying trends and trading. Different trends may exist at different levels, and small trends are part of the big trend. It is recommended to follow the trend at large level, find the same trend at small level to trade, and be cautious when trading against the trend.
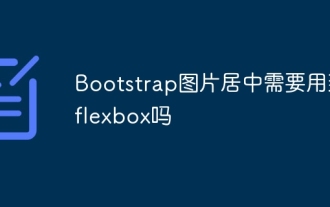
5. K-line support and pressure levels
Support and pressure levels are positions that touch and are blocked or reversed during an upward or decline in a price increase or decrease. It's not an exact price, but a range. When selecting the support pressure level, we should pay attention to consensus and effectiveness:
1. Key price identification
- Constant high/equal low point
- Supply and Demand Range
- Trendline
- Large-level closing price/opening price
- Price integer level
- The top/bottom of the long K-line with explosive volume is more than that of
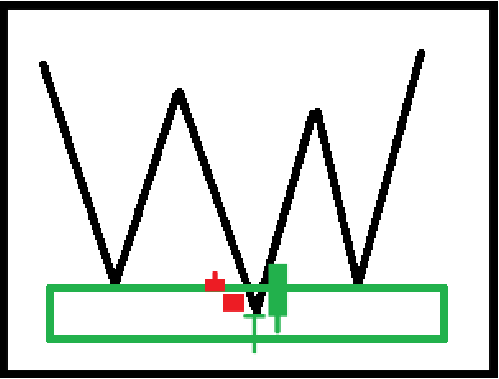
2. Test and conversion of support pressure levels
The support pressure level can be confirmed through multiple tests. Support pressure level swap means that the support level becomes a pressure level after it is broken, or the pressure level becomes a support level after it is broken.
Conclusion
Price Action Analysis is a technical analysis method based on price changes. Market price fluctuations are derived from the behavior of market participants, which are reflected in price patterns and trading volume. Its advantage is that it is easy to get started, but it requires accumulation of experience and the use of multiple methods to deal with market risks.
The above is the detailed content of Technical Analysis Teaching Guide: Judge Price Behavior through K-line. For more information, please follow other related articles on the PHP Chinese website!

Hot AI Tools

Undresser.AI Undress
AI-powered app for creating realistic nude photos

AI Clothes Remover
Online AI tool for removing clothes from photos.

Undress AI Tool
Undress images for free

Clothoff.io
AI clothes remover

AI Hentai Generator
Generate AI Hentai for free.

Hot Article
Hot Tools

Notepad++7.3.1
Easy-to-use and free code editor

SublimeText3 Chinese version
Chinese version, very easy to use

Zend Studio 13.0.1
Powerful PHP integrated development environment

Dreamweaver CS6
Visual web development tools

SublimeText3 Mac version
God-level code editing software (SublimeText3)
Hot Topics
 1377
1377
 52
52

 Does H5 page production require continuous maintenance?
Apr 05, 2025 pm 11:27 PM
Does H5 page production require continuous maintenance?
Apr 05, 2025 pm 11:27 PM
The H5 page needs to be maintained continuously, because of factors such as code vulnerabilities, browser compatibility, performance optimization, security updates and user experience improvements. Effective maintenance methods include establishing a complete testing system, using version control tools, regularly monitoring page performance, collecting user feedback and formulating maintenance plans.
 Do I need to use flexbox in the center of the Bootstrap picture?
Apr 07, 2025 am 09:06 AM
Do I need to use flexbox in the center of the Bootstrap picture?
Apr 07, 2025 am 09:06 AM
There are many ways to center Bootstrap pictures, and you don’t have to use Flexbox. If you only need to center horizontally, the text-center class is enough; if you need to center vertically or multiple elements, Flexbox or Grid is more suitable. Flexbox is less compatible and may increase complexity, while Grid is more powerful and has a higher learning cost. When choosing a method, you should weigh the pros and cons and choose the most suitable method according to your needs and preferences.
 Why does negative margins not take effect in some cases? How to solve this problem?
Apr 05, 2025 pm 10:18 PM
Why does negative margins not take effect in some cases? How to solve this problem?
Apr 05, 2025 pm 10:18 PM
Why do negative margins not take effect in some cases? During programming, negative margins in CSS (negative...
 How to change the size of a Bootstrap list?
Apr 07, 2025 am 10:45 AM
How to change the size of a Bootstrap list?
Apr 07, 2025 am 10:45 AM
The size of a Bootstrap list depends on the size of the container that contains the list, not the list itself. Using Bootstrap's grid system or Flexbox can control the size of the container, thereby indirectly resizing the list items.
 How to create complex card styles using CSS' clip-path property?
Apr 05, 2025 pm 11:09 PM
How to create complex card styles using CSS' clip-path property?
Apr 05, 2025 pm 11:09 PM
How to create complex card styles using CSS? In daily web design, card style is a common and important layout method. Today we want to explain...
 How to center images in containers for Bootstrap
Apr 07, 2025 am 09:12 AM
How to center images in containers for Bootstrap
Apr 07, 2025 am 09:12 AM
Overview: There are many ways to center images using Bootstrap. Basic method: Use the mx-auto class to center horizontally. Use the img-fluid class to adapt to the parent container. Use the d-block class to set the image to a block-level element (vertical centering). Advanced method: Flexbox layout: Use the justify-content-center and align-items-center properties. Grid layout: Use the place-items: center property. Best practice: Avoid unnecessary nesting and styles. Choose the best method for the project. Pay attention to the maintainability of the code and avoid sacrificing code quality to pursue the excitement
 Where to get the material for H5 page production
Apr 05, 2025 pm 11:33 PM
Where to get the material for H5 page production
Apr 05, 2025 pm 11:33 PM
The main sources of H5 page materials are: 1. Professional material website (paid, high quality, clear copyright); 2. Homemade material (high uniqueness, but time-consuming); 3. Open source material library (free, need to be carefully screened); 4. Picture/video website (copyright verified is required). In addition, unified material style, size adaptation, compression processing, and copyright protection are key points that need to be paid attention to.
 How to achieve horizontal scrolling effect of horizontal options by rotating elements in CSS?
Apr 05, 2025 pm 10:51 PM
How to achieve horizontal scrolling effect of horizontal options by rotating elements in CSS?
Apr 05, 2025 pm 10:51 PM
How to achieve horizontal scrolling effect of horizontal options in CSS? In modern web design, how to achieve a horizontal tab-like effect and support the mouse...