
RSI indicator: interpret market momentum and accurately grasp trading opportunities
RSI (relative strength indicator) is a momentum indicator commonly used in technical analysis. It is used to evaluate the potential momentum of asset prices and to determine whether the market is in an overbought or oversold state. This article will conduct in-depth discussion on the principles, usage methods and application of RSI indicators in cryptocurrency trading.
Detailed explanation of RSI indicators
RSI indicator was proposed by Welles Wilder in 1978, and its value fluctuates between 0 and 100, with 50 as the central axis. Above 50 is usually considered a long market, while below 50 is a short market.
It should be noted that under the strong trend, RSI may stay in overbought or oversold areas for a long time. Therefore, it is crucial to confirm in combination with other indicators. The bullish and bearish divergence of RSI is also an important analytical signal:
Calculation method of RSI indicator
The calculation formula of RSI is: RSI = [Average of rising / (Average of rising, average of falling)] × 100
Among them, the average value of the rise and the average value of the decline are the average value of the price increase and decline in a specific period respectively. For example, calculating the 6-day RSI requires the average of the price increase and decline in the past 6 days.
How to use RSI indicators
There are many ways to use the RSI indicator:
RSI indicator parameter setting and skills
The parameter setting of RSI indicator mainly involves time period selection. Short-term investors can choose shorter cycles (such as 4 days and 6 days), while long-term investors can choose longer cycles (such as 14 days and 21 days). In actual application, parameters need to be dynamically adjusted according to the market environment and personal trading strategies. Some practical tips include: focus on the dead golden fork, numerical range, morphological analysis, and the divergence of price from RSI.
Limitations of RSI indicators
RSI indicators are not perfect, the following problems may arise:
Application of RSI indicator in cryptocurrency trading
The cryptocurrency market is highly volatile, and RSI indicators should be used with caution. Other indicators need to be combined with attention and risk management is paid.
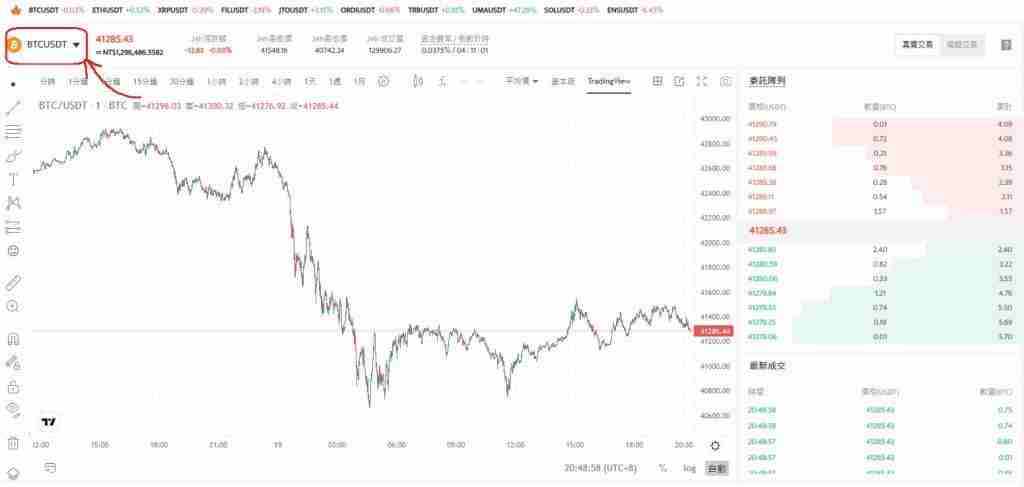
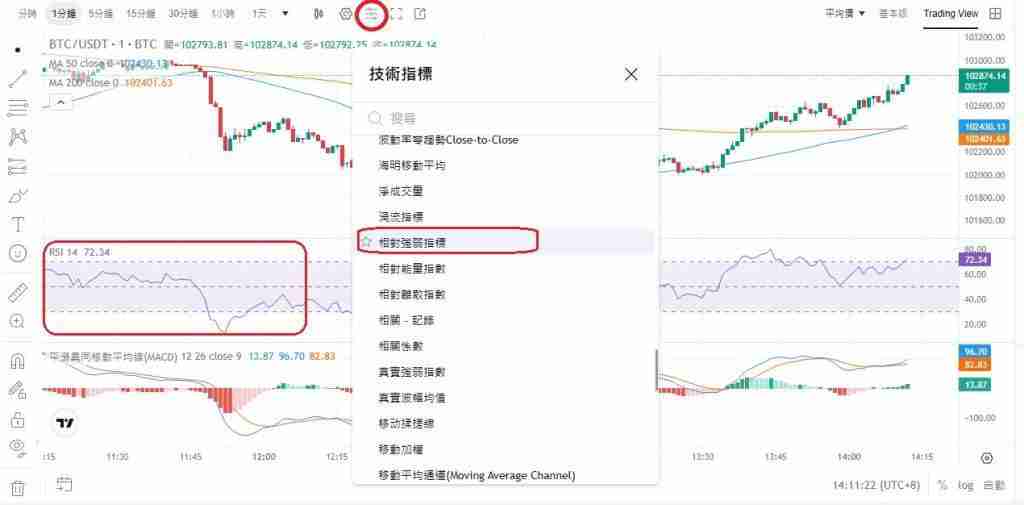
RSI indicator viewing platform
Many trading platforms (such as TradingView) provide RSI indicators. For example, BTCC exchange users can view TradingView charts directly on the platform and customize RSI parameters.
FAQ
Summary
RSI indicators are effective technical analysis tools, but they need to be used with caution and combined with other indicators and market analysis to improve the accuracy of trading decisions. Remember the importance of risk management.
The above is the detailed content of What are the RSI indicators in cryptocurrencies? How do you look at them? Is the higher the better?. For more information, please follow other related articles on the PHP Chinese website!


![[Web front-end] Node.js quick start](https://img.php.cn/upload/course/000/000/067/662b5d34ba7c0227.png)


