
 System Tutorial
LINUX
Optimizing Linux Server Performance: Benchmarking and Advanced Techniques
System Tutorial
LINUX
Optimizing Linux Server Performance: Benchmarking and Advanced Techniques
Optimizing Linux Server Performance: Benchmarking and Advanced Techniques


Introduction
In the IT infrastructure field, the performance of Linux servers is crucial, which directly affects business operations, user experience, and cost efficiency. Linux servers are well-known for their flexibility and open source features and are widely used in enterprise environments. Understanding how to evaluate and optimize its performance is critical to maintaining a strong and responsive IT ecosystem. This article delves into benchmarking and optimization techniques to ensure your Linux server performs at the best performance.
Understanding server performance metrics
Effective performance evaluation begins with a clear understanding of key metrics. These metrics provide snapshots of server health and performance, helping to identify potential bottlenecks.
CPU UtilizationCPU Utilization is the main indicator of server performance. It measures the level of CPU processing power usage. High CPU utilization may indicate excessive computational load, while low utilization may indicate insufficient resource utilization.
-
Monitoring Tools:
top,htopandmpstatprovide real-time information on CPU usage.topprovides a detailed view of the system processes, whilehtopprovides a more friendly interface with color-coded CPU and memory usage indicators.mpstatHelps monitor CPU utilization on multiple processors.
Memory Usage Memory (RAM) usage is another key metric. It reflects the extent to which the server RAM is used by the running process. Insufficient RAM can lead to overswitching, i.e. data moves between RAM and disk storage, thereby degrading performance.
-
Monitoring Tools:
freeandvmstatcommands quickly outline memory and exchange usage.freedisplays the total amount of free and used physical and swap memory, whilevmstatprovides a more detailed view of system performance, including memory, swap, and I/O statistics.
Disk I/O Disk I/O (Input/Output) performance is critical to tasks involving a large number of data read and write. If the storage subsystem fails to meet the needs, high disk I/O can slow down the server.
-
Monitoring Tools: Tools such as
iostat,dfandduhelp monitor disk performance.iostatProvide detailed statistics on disk I/O operations, display disk space usage, anddfhelp identify large files and directories that occupy disk space.du
Network Throughput Network throughput measures the speed at which data is transmitted over the network. Poor network performance can lead to slow response time and degraded user experience.
-
Monitoring Tools: Tools such as
iftop,netstatandiperfare crucial to monitoring network performance.iftopShow bandwidth usage,netstatProvide network connection, routing table and interface statistics, andiperfis used to measure maximum TCP and UDP bandwidth performance.
Linux Server Benchmark Test
Benchmarks are the process of running specific tests under various conditions to evaluate server performance. It helps to establish performance baselines and identify areas that need improvement.
Purpose of Benchmark Test Benchmark tests have multiple uses:
- Establish a baseline for normal performance levels.
- Identify performance bottlenecks.
- Compare performance before and after optimization or hardware changes.
Benchmark type
-
Comprehensive Benchmarks: These tests simulate specific workloads to evaluate system performance. Tools such as
Sysbenchand Phoronix Test Suite are commonly used.SysbenchWidely used, test CPU, memory, disk I/O and database performance. Phoronix Test Suite offers a wide range of benchmarks for a variety of components and applications. - Real-world benchmark: This involves testing the server's performance using the actual applications and workloads the server expects to process. This approach provides a more realistic performance measure.
Set the benchmark
-
Select Tools and Tests: Choose the right benchmark tool based on the role of the server and the performance aspects you want to evaluate. For example, use
Sysbenchfor general system performance testing and useiperffor network throughput testing. - Configuration environment: Ensure that the server is in a typical running state during testing. Avoid running other resource-intensive processes that may distort results.
Explanation of benchmark results Analyzing benchmark results involves comparing them to expected performance levels or industry standards. Find trends and patterns that indicate performance bottlenecks or areas that require improvement.
Optimization technology
Once you understand the performance metrics and establish a benchmark, the next step is to optimize. This involves tuning aspects of the server to improve performance.
CPU optimization
-
Process Scheduling and Priority Adjustment: Adjusting the scheduling priority of a process ensures that critical tasks get more CPU time. The
niceandrenicecommands are used to change process priorities. - Multi-threaded and multi-core utilization: Ensure that the application is optimized to utilize the multi-core processor. This can significantly improve the performance of parallelizable tasks.
Memory optimization
-
Manage memory allocation: Use tools such as
ulimitto control the resources available to the process, preventing any single process from consuming too much memory. -
Optimize switching usage: Ensure that sufficient switching space is configured. Adjust the swap parameters, such as
sysctl, usingvm.swappiness, it controls the kernel's tendency to move processes from physical memory to swap disk.
Disk I/O Optimization
-
File System Tuning: Choose the right file system (for example, ext4, XFS) for your needs and use the file system tuning options to optimize performance. Tools such as
tune2fscan adjust file system parameters. - RAID and SSD: Implement RAID configuration for improved redundancy and performance. Because SSDs read and write faster, using SSD instead of HDD can significantly improve I/O performance.
Network Optimization
-
Adjust the network parameters: Use
sysctlto adjust the network stack parameters. For example, increasing the TCP buffer size can improve network performance. - Optimized configuration: Ensure that both the server and client network configurations are optimized. This includes setting the proper MTU size and correctly configuring the network interface.
Advanced Performance Tuning
For those looking to push performance limits, advanced tuning technology provides further optimization.
Kernel adjustment
-
Adjust kernel parameters: Use
sysctlto modify kernel parameters for performance adjustment. Parameters such asvm.dirty_ratioandnet.core.somaxconncan be adjusted to optimize memory and network performance. -
Real-time adjustment tools: Tools such as
tunedandsysctlprovide real-time adjustments, allowing dynamic adjustments to be made according to the current workload conditions.
Cache Strategy
-
Implementation of caching: Effective caching can significantly reduce load time and improve performance. Tools such as
MemcachedandRedisare often used as memory caches to store frequently accessed data for quick retrieval. - Optimize cache configuration: Adjust cache size and eviction policy to match workload and data access patterns to ensure optimal performance.
Load balancing
- Distribute workloads: Load balancing distributes incoming network traffic to multiple servers, preventing any single server from becoming a bottleneck. This ensures better resource utilization and higher performance.
-
Load Balancing Tools: Tools such as
NginxandHAProxyare widely used for load balancing. They provide powerful capabilities for allocating traffic and effectively managing server load.
Monitoring and Maintenance
Optimization is not a one-time task. Continuous monitoring and regular maintenance are essential to maintaining optimal performance.
Continuous performance monitoring
- The importance of regular monitoring: Continuous monitoring helps identify performance issues early, allowing proactive actions before impacting users.
-
Monitoring Tools: Tools such as
NagiosandZabbixprovide comprehensive monitoring solutions. They can track various performance metrics, generate alerts and provide detailed reports.
Automatic Alarms and Reports
- Set Alarms: Configure alerts for critical performance thresholds. This ensures that administrators are notified before the issue escalates.
- Generate reports: Regular performance reports help track trends and make informed decisions about infrastructure improvements.
Regular maintenance and updates
- Keep software updates: Regularly update the server's operating system and software to ensure application security and performance improvements.
- Maintenance Best Practices: Implement routine maintenance plans, including tasks such as disk cleaning, log management, and hardware inspection to ensure smooth server operation.
Conclusion
In short, evaluating and optimizing Linux server performance involves systematic monitoring of key metrics, conducting benchmarks to establish performance baselines, and applying targeted optimization techniques. By understanding and managing CPU, memory, disk I/O and network performance, administrators can ensure their servers run efficiently. Advanced tuning, continuous monitoring, and regular maintenance further improve performance to ensure that Linux servers meet the needs of modern IT environments.
The above is the detailed content of Optimizing Linux Server Performance: Benchmarking and Advanced Techniques. For more information, please follow other related articles on the PHP Chinese website!

Hot AI Tools

Undresser.AI Undress
AI-powered app for creating realistic nude photos

AI Clothes Remover
Online AI tool for removing clothes from photos.

Undress AI Tool
Undress images for free

Clothoff.io
AI clothes remover

AI Hentai Generator
Generate AI Hentai for free.

Hot Article
Hot Tools

Notepad++7.3.1
Easy-to-use and free code editor

SublimeText3 Chinese version
Chinese version, very easy to use

Zend Studio 13.0.1
Powerful PHP integrated development environment

Dreamweaver CS6
Visual web development tools

SublimeText3 Mac version
God-level code editing software (SublimeText3)
Hot Topics
 1381
1381
 52
52

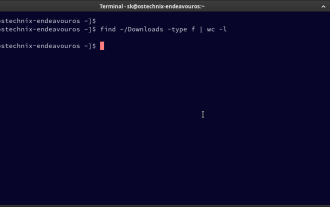 How To Count Files And Directories In Linux: A Beginner's Guide
Mar 19, 2025 am 10:48 AM
How To Count Files And Directories In Linux: A Beginner's Guide
Mar 19, 2025 am 10:48 AM
Efficiently Counting Files and Folders in Linux: A Comprehensive Guide Knowing how to quickly count files and directories in Linux is crucial for system administrators and anyone managing large datasets. This guide demonstrates using simple command-l
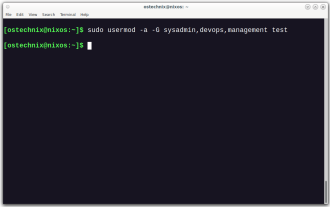 How To Add A User To Multiple Groups In Linux
Mar 18, 2025 am 11:44 AM
How To Add A User To Multiple Groups In Linux
Mar 18, 2025 am 11:44 AM
Efficiently managing user accounts and group memberships is crucial for Linux/Unix system administration. This ensures proper resource and data access control. This tutorial details how to add a user to multiple groups in Linux and Unix systems. We
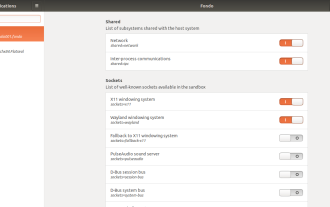 How To Easily Configure Flatpak Apps Permissions With Flatseal
Mar 22, 2025 am 09:21 AM
How To Easily Configure Flatpak Apps Permissions With Flatseal
Mar 22, 2025 am 09:21 AM
Flatpak application permission management tool: Flatseal User Guide Flatpak is a tool designed to simplify Linux software distribution and use. It safely encapsulates applications in a virtual sandbox, allowing users to run applications without root permissions without affecting system security. Because Flatpak applications are located in this sandbox environment, they must request permissions to access other parts of the operating system, hardware devices (such as Bluetooth, network, etc.) and sockets (such as pulseaudio, ssh-auth, cups, etc.). This guide will guide you on how to easily configure Flatpak with Flatseal on Linux
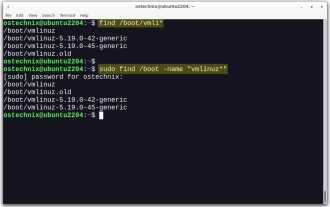 How To List Or Check All Installed Linux Kernels From Commandline
Mar 23, 2025 am 10:43 AM
How To List Or Check All Installed Linux Kernels From Commandline
Mar 23, 2025 am 10:43 AM
Linux Kernel is the core component of a GNU/Linux operating system. Developed by Linus Torvalds in 1991, it is a free, open-source, monolithic, modular, and multitasking Unix-like kernel. In Linux, it is possible to install multiple kernels on a sing
 How To Type Indian Rupee Symbol In Ubuntu Linux
Mar 22, 2025 am 10:39 AM
How To Type Indian Rupee Symbol In Ubuntu Linux
Mar 22, 2025 am 10:39 AM
This brief guide explains how to type Indian Rupee symbol in Linux operating systems. The other day, I wanted to type "Indian Rupee Symbol (₹)" in a word document. My keyboard has a rupee symbol on it, but I don't know how to type it. After
 What is the Linux best used for?
Apr 03, 2025 am 12:11 AM
What is the Linux best used for?
Apr 03, 2025 am 12:11 AM
Linux is best used as server management, embedded systems and desktop environments. 1) In server management, Linux is used to host websites, databases, and applications, providing stability and reliability. 2) In embedded systems, Linux is widely used in smart home and automotive electronic systems because of its flexibility and stability. 3) In the desktop environment, Linux provides rich applications and efficient performance.
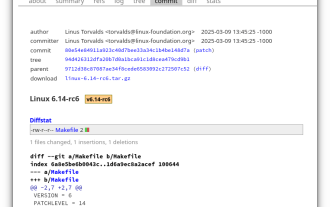 Linux Kernel 6.14 RC6 Released
Mar 24, 2025 am 10:21 AM
Linux Kernel 6.14 RC6 Released
Mar 24, 2025 am 10:21 AM
Linus Torvalds has released Linux Kernel 6.14 Release Candidate 6 (RC6), reporting no significant issues and keeping the release on track. The most notable change in this update addresses an AMD microcode signing issue, while the rest of the updates
 Yt-dlp Commands: The Complete Tutorial For Beginners (2025)
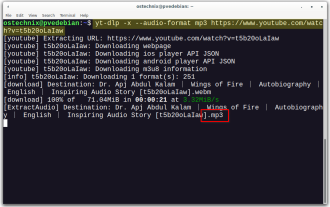
Mar 21, 2025 am 11:00 AM
Yt-dlp Commands: The Complete Tutorial For Beginners (2025)
Mar 21, 2025 am 11:00 AM
Have you ever wanted to save your favorite videos from the internet? Whether it's a funny cat video or a tutorial you want to watch later, Yt-dlp is here to help! In this comprehensive yt-dlp tutorial, we will explain what yt-dlp is, how to install i
