

Top 50 Data Analyst Interview Questions


Data analysis underpins crucial high-level decisions in modern economies. This comprehensive guide explores 50 key data analyst interview questions, progressing from fundamental concepts to advanced techniques like Generative AI. Mastering these questions enhances your analytical skills and builds confidence in tackling real-world data challenges.
Beginner Level
This section covers essential data analysis concepts and tools, focusing on statistics, data cleaning, and introductory SQL.
Q1. Define data analysis and its significance.
A1. Data analysis involves collecting, organizing, and interpreting data to reveal patterns, trends, and insights. It's crucial for informed decision-making in organizations, enabling identification of opportunities, risks, and process improvements. For example, analyzing sales data can reveal best-selling products, informing inventory management.
Q2. Categorize different data types.
A2. Data is broadly classified as:
- Structured: Organized in a tabular format (databases, spreadsheets).
- Unstructured: Lacks predefined format (text, images, videos).
- Semi-structured: Exhibits some organizational structure (XML, JSON).
Q3. Differentiate between qualitative and quantitative data.
A3.
- Qualitative: Descriptive, representing characteristics or features (customer feedback).
- Quantitative: Measurable, numerical data (sales figures, temperatures).
Q4. Describe the role of a data analyst.
A4. Data analysts transform raw data into actionable business intelligence. This involves data acquisition, cleaning, exploration, and the creation of reports and dashboards to support strategic decision-making.
Q5. Distinguish between primary and secondary data.
A5.
- Primary: Collected firsthand (surveys, experiments).
- Secondary: Already existing data (government reports, market research).
Q6. Highlight the importance of data visualization.
A6. Data visualization transforms data into easily understandable charts and graphs, revealing patterns and trends more readily than raw data. For instance, a line chart showing sales over time quickly illustrates peak sales periods.
Q7. List common data storage file formats.
A7. Common formats include CSV (comma-separated values), JSON (JavaScript Object Notation), XML (Extensible Markup Language), Excel spreadsheets, and SQL databases.
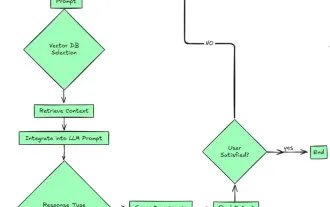
Q8. Explain data pipelines and their importance.
A8. Data pipelines automate data movement from source to destination (data warehouse) for analysis, often incorporating ETL (Extract, Transform, Load) processes for data cleaning and preparation.
Q9. How do you handle duplicate data?
A9. Duplicate data can be identified using SQL (DISTINCT keyword) or Python's pandas drop_duplicates() function. After identification, duplicates can be removed or further analyzed to determine their relevance.
Q10. Define KPIs and their application.
A10. KPIs (Key Performance Indicators) are quantifiable metrics measuring progress toward objectives. For example, "monthly revenue increase" is a sales KPI indicating progress towards sales goals.
Intermediate Level
This section delves deeper into data visualization, advanced Excel functions, and Python libraries for data analysis.
Q11. Explain database normalization.
A11. Normalization organizes databases to reduce redundancy and improve data integrity. For example, separating customer information and order details into related tables prevents data duplication and ensures consistency.
Q12. Differentiate between histograms and bar charts.
A12.
- Histograms: Show the frequency distribution of numerical data using bins.
- Bar charts: Compare categorical data, with bars representing counts or values.
Q13. What are the common challenges in data cleaning?
A13. Challenges include handling missing data, identifying and removing outliers, standardizing inconsistent formats, resolving duplicates, and ensuring data aligns with analysis objectives.
Q14. Explain SQL joins.
A14. SQL joins combine data from multiple tables based on related columns. Types include INNER JOIN (matching rows only), LEFT JOIN (all rows from the left table), and FULL JOIN (all rows from both tables).
Q15. What is time series analysis?
A15. Time series analysis examines data points ordered chronologically (stock prices, sales data) to identify trends and patterns, often using techniques like moving averages or ARIMA models for forecasting.
Q16. What is A/B testing?
A16. A/B testing compares two versions of a variable (website design) to determine which performs better. For example, comparing two website layouts to see which drives higher conversion rates.
Q17. How would you measure marketing campaign success?
A17. KPIs like conversion rate, ROI (Return on Investment), customer acquisition cost, and CTR (Click-Through Rate) measure marketing campaign effectiveness.
Q18. What is overfitting in data modeling?
A18. Overfitting occurs when a model learns the training data's noise, resulting in high training accuracy but poor performance on new data. Techniques like regularization mitigate overfitting.
Advanced Level
This section explores predictive modeling, machine learning, and Generative AI in data analysis.
Q19. How can Generative AI be used in data analysis?
A19. Generative AI can automate data cleaning, generate synthetic datasets, provide insights through natural language processing, and create visualizations based on prompts.
Q20. What is anomaly detection?
A20. Anomaly detection identifies unusual data points that deviate significantly from the norm, useful for fraud detection, security monitoring, and predictive maintenance.
Q21. Differentiate between ETL and ELT.
A21.
- ETL (Extract, Transform, Load): Data is transformed before loading into the destination.
- ELT (Extract, Load, Transform): Data is loaded first, then transformed. ELT is better suited for large datasets.
Q22. Explain dimensionality reduction.
A22. Dimensionality reduction reduces the number of variables in a dataset while preserving important information. Techniques like PCA (Principal Component Analysis) are used to simplify data and improve model performance.
Q23. How to handle multicollinearity?
A23. Multicollinearity (high correlation between independent variables) can be addressed by removing correlated variables, using regularization (Ridge or Lasso regression), or applying dimensionality reduction.
Q24. Why is feature scaling important?
A24. Feature scaling ensures variables have similar magnitudes, preventing features with larger values from dominating machine learning algorithms. Techniques include Min-Max scaling and standardization.
Q25. How to deal with outliers?
A25. Outliers (extreme values) can distort analysis. Handling them involves identification (box plots, scatter plots), removal, capping (limiting extreme values), or transformations (log scaling).
Q26. Explain correlation vs. causation.
A26. Correlation indicates a statistical relationship, but not necessarily a causal one. Causation implies a direct cause-and-effect relationship. Ice cream sales and drowning incidents may correlate (both increase in summer heat), but one doesn't cause the other.
Q27. Key performance metrics for regression models?
A27. MAE (Mean Absolute Error), MSE (Mean Squared Error), and R-squared (proportion of variance explained) are common regression model evaluation metrics.
Q28. How to ensure reproducibility in data analysis?
A28. Reproducibility is ensured through version control (Git), detailed documentation of the analysis pipeline, and sharing datasets and environments (Docker, conda).
Q29. What is the significance of cross-validation?
A29. Cross-validation divides data into subsets for model training and evaluation, improving model generalization and reducing overfitting. K-fold cross-validation is a common technique.
Q30. Explain data imputation.
A30. Data imputation replaces missing values with estimated ones (mean, median, mode, or predictive methods), making the dataset complete for analysis.
Q31. Common clustering algorithms?
A31. K-means, DBSCAN (Density-Based Spatial Clustering of Applications with Noise), and hierarchical clustering are common clustering algorithms.
Q32. Explain bootstrapping.
A32. Bootstrapping is a resampling technique that creates multiple datasets from the original data to estimate population parameters and assess statistical significance without distributional assumptions.
Q33. What are neural networks and their applications in data analysis?
A33. Neural networks are machine learning models inspired by the brain's structure. They are used in image recognition, natural language processing, and forecasting.
Q34. Advanced SQL for data analysis.
A34. Advanced SQL involves complex queries (nested subqueries, window functions), CTEs (Common Table Expressions), and pivot tables for data summarization.
Q35. What is feature engineering?
A35. Feature engineering creates new features from existing ones to improve model performance. For example, extracting "day of the week" from a timestamp might improve sales forecasting.
Q36. How to interpret p-values?
A36. The p-value represents the probability of observing the obtained results if the null hypothesis is true. A p-value below a significance level (e.g., 0.05) suggests rejecting the null hypothesis.
Q37. What is a recommendation system?
A37. Recommendation systems suggest items to users based on their preferences, using techniques like collaborative filtering (user-item interactions) and content-based filtering (item features).
Q38. NLP applications in data analysis.
A38. NLP (Natural Language Processing) enables sentiment analysis, text summarization, and keyword extraction from textual data.
Q39. What is reinforcement learning and its role in decision-making?
A39. Reinforcement learning trains agents to make sequential decisions by rewarding desired actions. It's useful in dynamic pricing and supply chain optimization.
Q40. How to evaluate clustering results?
A40. Metrics like Silhouette Score (measures cluster cohesion and separation) and Dunn Index (evaluates compactness and separation) assess clustering quality. Visual inspection is also helpful for low-dimensional data.
Q41. Analyzing time series data.
A41. Time series analysis involves trend analysis, seasonality detection, and forecasting using models like ARIMA.
Q42. How anomaly detection improves business processes.
A42. Anomaly detection identifies unusual patterns, helping businesses prevent fraud, equipment failure, and security breaches, leading to improved efficiency and reduced losses.
Q43. The role of regularization in machine learning.
A43. Regularization (L1 or Lasso, L2 or Ridge) prevents overfitting by adding penalties to model complexity, improving generalization.
Q44. Challenges in big data analytics.
A44. Challenges include data quality, scalability, integration of diverse data sources, and privacy concerns.
Q45. Python for sentiment analysis.
A45. Python libraries (NLTK, TextBlob, spaCy) facilitate sentiment analysis by preprocessing text, analyzing polarity, and visualizing results.
Q46. What is a covariance matrix?
A46. A covariance matrix shows the pairwise covariance between multiple variables, used in PCA and portfolio optimization.
Q47. Feature selection for high-dimensional datasets.
A47. Techniques include filter methods (statistical tests), wrapper methods (recursive feature elimination), and embedded methods (Lasso regression).
Q48. Monte Carlo simulation in data analysis.
A48. Monte Carlo simulation uses random sampling to estimate probabilities, useful in financial modeling and risk assessment.
Q49. Generative AI in predictive analytics.
A49. Generative AI models can create realistic simulations, automate feature generation, and improve forecasting accuracy.
Q50. Key considerations when deploying a machine learning model.
A50. Considerations include scalability, monitoring, integration with existing systems, and ethical and compliance aspects.
Conclusion
This guide provides a comprehensive overview of key data analyst interview questions. Thorough understanding of the underlying concepts, not just memorization of answers, is crucial for success. The ability to apply knowledge creatively and think critically is essential in the ever-evolving field of data analytics.
The above is the detailed content of Top 50 Data Analyst Interview Questions. For more information, please follow other related articles on the PHP Chinese website!

Hot AI Tools

Undresser.AI Undress
AI-powered app for creating realistic nude photos

AI Clothes Remover
Online AI tool for removing clothes from photos.

Undress AI Tool
Undress images for free

Clothoff.io
AI clothes remover

Video Face Swap
Swap faces in any video effortlessly with our completely free AI face swap tool!

Hot Article
Hot Tools

Notepad++7.3.1
Easy-to-use and free code editor

SublimeText3 Chinese version
Chinese version, very easy to use

Zend Studio 13.0.1
Powerful PHP integrated development environment

Dreamweaver CS6
Visual web development tools

SublimeText3 Mac version
God-level code editing software (SublimeText3)
Hot Topics


 Best AI Art Generators (Free & Paid) for Creative Projects
Apr 02, 2025 pm 06:10 PM
Best AI Art Generators (Free & Paid) for Creative Projects
Apr 02, 2025 pm 06:10 PM
The article reviews top AI art generators, discussing their features, suitability for creative projects, and value. It highlights Midjourney as the best value for professionals and recommends DALL-E 2 for high-quality, customizable art.
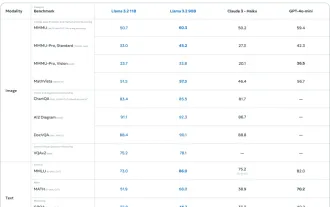
 Getting Started With Meta Llama 3.2 - Analytics Vidhya
Apr 11, 2025 pm 12:04 PM
Getting Started With Meta Llama 3.2 - Analytics Vidhya
Apr 11, 2025 pm 12:04 PM
Meta's Llama 3.2: A Leap Forward in Multimodal and Mobile AI Meta recently unveiled Llama 3.2, a significant advancement in AI featuring powerful vision capabilities and lightweight text models optimized for mobile devices. Building on the success o
 Best AI Chatbots Compared (ChatGPT, Gemini, Claude & More)
Apr 02, 2025 pm 06:09 PM
Best AI Chatbots Compared (ChatGPT, Gemini, Claude & More)
Apr 02, 2025 pm 06:09 PM
The article compares top AI chatbots like ChatGPT, Gemini, and Claude, focusing on their unique features, customization options, and performance in natural language processing and reliability.
 Is ChatGPT 4 O available?
Mar 28, 2025 pm 05:29 PM
Is ChatGPT 4 O available?
Mar 28, 2025 pm 05:29 PM
ChatGPT 4 is currently available and widely used, demonstrating significant improvements in understanding context and generating coherent responses compared to its predecessors like ChatGPT 3.5. Future developments may include more personalized interactions and real-time data processing capabilities, further enhancing its potential for various applications.
 Top AI Writing Assistants to Boost Your Content Creation
Apr 02, 2025 pm 06:11 PM
Top AI Writing Assistants to Boost Your Content Creation
Apr 02, 2025 pm 06:11 PM
The article discusses top AI writing assistants like Grammarly, Jasper, Copy.ai, Writesonic, and Rytr, focusing on their unique features for content creation. It argues that Jasper excels in SEO optimization, while AI tools help maintain tone consist
 Top 7 Agentic RAG System to Build AI Agents
Mar 31, 2025 pm 04:25 PM
Top 7 Agentic RAG System to Build AI Agents
Mar 31, 2025 pm 04:25 PM
2024 witnessed a shift from simply using LLMs for content generation to understanding their inner workings. This exploration led to the discovery of AI Agents – autonomous systems handling tasks and decisions with minimal human intervention. Buildin
 Choosing the Best AI Voice Generator: Top Options Reviewed
Apr 02, 2025 pm 06:12 PM
Choosing the Best AI Voice Generator: Top Options Reviewed
Apr 02, 2025 pm 06:12 PM
The article reviews top AI voice generators like Google Cloud, Amazon Polly, Microsoft Azure, IBM Watson, and Descript, focusing on their features, voice quality, and suitability for different needs.
 AV Bytes: Meta's Llama 3.2, Google's Gemini 1.5, and More
Apr 11, 2025 pm 12:01 PM
AV Bytes: Meta's Llama 3.2, Google's Gemini 1.5, and More
Apr 11, 2025 pm 12:01 PM
This week's AI landscape: A whirlwind of advancements, ethical considerations, and regulatory debates. Major players like OpenAI, Google, Meta, and Microsoft have unleashed a torrent of updates, from groundbreaking new models to crucial shifts in le
