

System Performance Monitoring and Tuning Guide


introduction
Linux occupies an important position in the field of computing for its flexibility and powerful capabilities. However, like an instrument, it needs to be tuned regularly to perform optimally. This article will explore the secrets of Linux system performance in depth, focusing on the importance of monitoring and active tuning.
Basic knowledge
What is Linux system performance?
The core of system performance lies in the efficiency of computer systems in performing tasks and responding to requirements. Good performance ensures that the system runs smoothly, while poor performance can lead to bottlenecks and delays.
The difference between monitoring and tuning
While the two are closely related, monitoring refers to the behavior of observing and recording the state of the system, while tuning involves making adjustments to improve its performance.
Key indicators of Linux system performance monitoring
- CPU metrics : Including load average (an metric that measures task requirements over a period of time), utilization (the busyness of the CPU), and context switching (the frequency of the CPU switching tasks).
- Memory metrics : Tracks the available memory, swap space usage (memory overflow space), and the status of buffers and caches (temporary storage space).
- Disk metrics : Including I/O operations (data transfer), disk utilization and latency (data transfer delay).
- Network metrics : Monitor bandwidth usage, packet loss rate (discarded data), and transmission errors.
- Process Metrics : Provides insights into running processes and their CPU and memory resource consumption.
Monitoring tools
Built-in tools
-
top&htop: Real-time system monitor. -
vmstat: Provides information about processes, memory, paging, etc. -
iostat: Monitor the system input/output device load. -
netstat: Network statistics. -
free: Shows the amount of free and used memory.
Graphical tools
- GNOME system monitor: intuitively view system processes, resource usage, etc.
- KDE system daemon: KDE's own system monitoring tool.
Advanced monitoring solutions :
- Nagios: Enterprise-level monitoring for host, service, and network attributes.
- Grafana and Prometheus: A powerful combination of dashboards for real-time monitoring.
- Zabbix: Enterprise-level open source real-time monitoring software.
Performance Tuning
Tuning goals
The goal is simple - achieve better system performance and optimal resource utilization.
Tuning method
Static tuning (permanent adjustment) and dynamic tuning (temporary adjustments that can be recovered).
Tuning technology for key system resources
CPU Tuning
- Use
niceandreniceto manage process priorities. - Set CPU affinity to bind processes to specific CPU cores.
Memory tuning
- Adjust
swappinessto control the kernel's tendency to move processes out of physical memory. - Fine-tune cache parameters to optimize memory usage.
Disk I/O Tuning
- Choose the correct file system type (e.g. ext4, XFS) according to your needs.
- Choose the most efficient I/O scheduler for your workload.
Network tuning
- Fine-tune the buffer size to optimize data flow.
- Modify TCP parameters to enhance network performance.
Process Tuning
- Use
ulimitto set process resource limits. - Use cgroups to manage and monitor process groups' system resources.
Automation performance monitoring and optimization
Using tools such as cron , you can automate monitoring tasks and generate alerts for exceptions. Automation not only reduces manual intervention, but also ensures timely optimization and system cleaning.
Common performance problems and solutions
Identify and resolve bottlenecks in various system resources. Some examples include:
- High load average: Check for out-of-control processes or insufficient CPU resources.
- Overswap: Increase physical memory or optimize memory usage.
- Disk Jitter: Check for too many I/O operations and optimize.
- Network congestion: Addressing issues related to bandwidth limitations or excessive traffic.
in conclusion
As we have seen, Linux systems, while powerful, require meticulous maintenance to perform at the best performance. Regular monitoring and tuning is not just best practice; they are essential measures for anyone who is serious about maintaining an efficient Linux system.
The above is the detailed content of System Performance Monitoring and Tuning Guide. For more information, please follow other related articles on the PHP Chinese website!

Hot AI Tools

Undresser.AI Undress
AI-powered app for creating realistic nude photos

AI Clothes Remover
Online AI tool for removing clothes from photos.

Undress AI Tool
Undress images for free

Clothoff.io
AI clothes remover

AI Hentai Generator
Generate AI Hentai for free.

Hot Article
Hot Tools

Notepad++7.3.1
Easy-to-use and free code editor

SublimeText3 Chinese version
Chinese version, very easy to use

Zend Studio 13.0.1
Powerful PHP integrated development environment

Dreamweaver CS6
Visual web development tools

SublimeText3 Mac version
God-level code editing software (SublimeText3)
Hot Topics
 1382
1382
 52
52

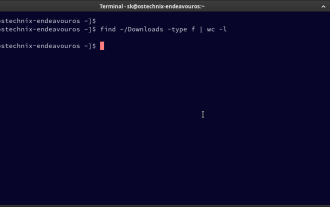 How To Count Files And Directories In Linux: A Beginner's Guide
Mar 19, 2025 am 10:48 AM
How To Count Files And Directories In Linux: A Beginner's Guide
Mar 19, 2025 am 10:48 AM
Efficiently Counting Files and Folders in Linux: A Comprehensive Guide Knowing how to quickly count files and directories in Linux is crucial for system administrators and anyone managing large datasets. This guide demonstrates using simple command-l
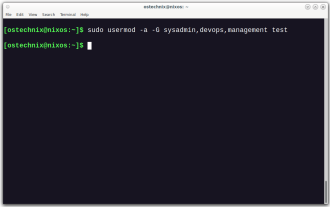 How To Add A User To Multiple Groups In Linux
Mar 18, 2025 am 11:44 AM
How To Add A User To Multiple Groups In Linux
Mar 18, 2025 am 11:44 AM
Efficiently managing user accounts and group memberships is crucial for Linux/Unix system administration. This ensures proper resource and data access control. This tutorial details how to add a user to multiple groups in Linux and Unix systems. We
 How To Easily Configure Flatpak Apps Permissions With Flatseal
Mar 22, 2025 am 09:21 AM
How To Easily Configure Flatpak Apps Permissions With Flatseal
Mar 22, 2025 am 09:21 AM
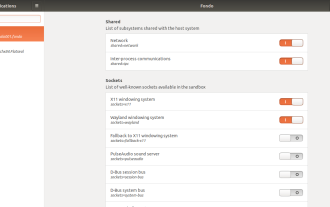
Flatpak application permission management tool: Flatseal User Guide Flatpak is a tool designed to simplify Linux software distribution and use. It safely encapsulates applications in a virtual sandbox, allowing users to run applications without root permissions without affecting system security. Because Flatpak applications are located in this sandbox environment, they must request permissions to access other parts of the operating system, hardware devices (such as Bluetooth, network, etc.) and sockets (such as pulseaudio, ssh-auth, cups, etc.). This guide will guide you on how to easily configure Flatpak with Flatseal on Linux
 How To List Or Check All Installed Linux Kernels From Commandline
Mar 23, 2025 am 10:43 AM
How To List Or Check All Installed Linux Kernels From Commandline
Mar 23, 2025 am 10:43 AM
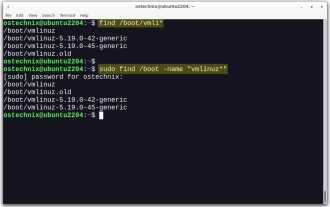
Linux Kernel is the core component of a GNU/Linux operating system. Developed by Linus Torvalds in 1991, it is a free, open-source, monolithic, modular, and multitasking Unix-like kernel. In Linux, it is possible to install multiple kernels on a sing
 How To Type Indian Rupee Symbol In Ubuntu Linux
Mar 22, 2025 am 10:39 AM
How To Type Indian Rupee Symbol In Ubuntu Linux
Mar 22, 2025 am 10:39 AM
This brief guide explains how to type Indian Rupee symbol in Linux operating systems. The other day, I wanted to type "Indian Rupee Symbol (₹)" in a word document. My keyboard has a rupee symbol on it, but I don't know how to type it. After
 Yt-dlp Commands: The Complete Tutorial For Beginners (2025)
Mar 21, 2025 am 11:00 AM
Yt-dlp Commands: The Complete Tutorial For Beginners (2025)
Mar 21, 2025 am 11:00 AM
Have you ever wanted to save your favorite videos from the internet? Whether it's a funny cat video or a tutorial you want to watch later, Yt-dlp is here to help! In this comprehensive yt-dlp tutorial, we will explain what yt-dlp is, how to install i
 What is the Linux best used for?
Apr 03, 2025 am 12:11 AM
What is the Linux best used for?
Apr 03, 2025 am 12:11 AM
Linux is best used as server management, embedded systems and desktop environments. 1) In server management, Linux is used to host websites, databases, and applications, providing stability and reliability. 2) In embedded systems, Linux is widely used in smart home and automotive electronic systems because of its flexibility and stability. 3) In the desktop environment, Linux provides rich applications and efficient performance.
 LocalSend - The Open-Source Airdrop Alternative For Secure File Sharing
Mar 24, 2025 am 09:20 AM
LocalSend - The Open-Source Airdrop Alternative For Secure File Sharing
Mar 24, 2025 am 09:20 AM
If you're familiar with AirDrop, you know it's a popular feature developed by Apple Inc. that enables seamless file transfer between supported Macintosh computers and iOS devices using Wi-Fi and Bluetooth. However, if you're using Linux and missing o
