

how to make a table in excel

How to Make a Table in Excel
Creating a table in Excel is a straightforward process that can help you organize and analyze your data more effectively. Here are the steps to create a basic table:
- Open Excel: Start by opening Microsoft Excel on your computer.
- Enter Data: Input your data into the worksheet. Ensure that your data is organized in rows and columns, with headers at the top of each column.
- Select Data: Click and drag to select the range of cells that you want to convert into a table. Make sure to include the headers.
-
Insert Table: Go to the "Insert" tab on the ribbon, and click on the "Table" button. Alternatively, you can use the shortcut
Ctrl T. - Confirm Table Range: A dialog box will appear, asking you to confirm the range of cells you've selected. Ensure the "My table has headers" checkbox is ticked if your data includes headers, then click "OK."
- Table Creation: Excel will automatically format your selected data into a table, with filter arrows in the header row for easy data sorting and filtering.
What are the Steps to Format a Table in Excel?
Formatting a table in Excel helps improve readability and can make your data more visually appealing. Here are the steps to format a table:
- Select the Table: Click anywhere inside the table you want to format.
- Access Table Tools: Once the table is selected, the "Table Design" tab will appear on the ribbon. Click on it to access various formatting options.
- Choose a Table Style: Under the "Table Styles" section, you'll see various pre-designed table styles. Click on one to apply it to your table. You can hover over the styles to see a live preview before making a selection.
- Customize Table Style: If you want more control over the formatting, click on the "More" button (it looks like a small arrow) in the "Table Styles" section to expand the gallery. You can also use the "New Table Style" option to create a custom style.
- Adjust Table Elements: Use the options in the "Table Style Options" group to toggle features like header row, total row, banded rows, and banded columns on or off.
- Resize the Table: If you need to adjust the size of your table, you can drag the resize handle in the bottom-right corner of the table, or use the "Resize Table" option found under the "Table Design" tab.
- Format Cells: To further customize individual cells, rows, or columns, you can use the standard Excel formatting tools found in the "Home" tab, such as font size, cell color, and borders.
How Can I Customize the Style of a Table in Excel?
Customizing the style of a table in Excel allows you to tailor its appearance to suit your preferences or to meet specific requirements. Here's how you can do it:
- Select the Table: Click inside the table to select it.
- Open Table Design: Go to the "Table Design" tab on the ribbon.
- Select a Predefined Style: Browse through the "Table Styles" gallery and select a style that suits your needs. Hover over the styles to see a live preview.
- Create a Custom Style: If none of the predefined styles meet your requirements, click on "New Table Style" in the "Table Styles" gallery. This opens a dialog box where you can define every aspect of the table's appearance, including font, colors, and border styles.
- Modify Table Elements: Use the "Table Style Options" to toggle on or off elements such as header row, total row, first column, last column, banded rows, and banded columns.
- Adjust Cell Formatting: Use the formatting tools in the "Home" tab to change the font, size, color, and alignment of cells within the table. You can also apply conditional formatting to highlight specific data based on certain criteria.
- Save Custom Style: If you've created a custom style that you want to use in the future, click "New Table Style," name your style, and click "OK." Your custom style will then be available in the "Table Styles" gallery.
What Functions Can I Use to Analyze Data Within an Excel Table?
Excel offers a variety of functions and tools that can be used to analyze data within a table. Here are some useful functions and their applications:
-
SUM: This function calculates the total of selected numerical values. For example,
=SUM(Table1[Column1])will sum all values in Column1 of Table1. -
AVERAGE: This function calculates the average of selected numerical values. For instance,
=AVERAGE(Table1[Column1])will find the average of all values in Column1 of Table1. -
MIN and MAX: These functions find the minimum and maximum values in a range. For example,
=MIN(Table1[Column1])and=MAX(Table1[Column1])will return the lowest and highest values in Column1, respectively. -
COUNT and COUNTA: These functions count the number of cells that contain numbers or any type of data, respectively. For instance,
=COUNT(Table1[Column1])will count the number of cells with numerical values in Column1, while=COUNTA(Table1[Column1])will count all non-empty cells. -
VLOOKUP and HLOOKUP: These functions allow you to search for a value in a table and return a corresponding value from another column or row. For example,
=VLOOKUP(value, Table1, column_index, FALSE)will look up a value in Table1 and return data from the specified column. -
INDEX and MATCH: These functions can be used together to perform more flexible lookups than VLOOKUP or HLOOKUP.
=INDEX(Table1[Column1], MATCH(value, Table1[Column2], 0))will find a value in Column2 and return the corresponding value from Column1. -
SUBTOTAL: This function calculates a subtotal in a list or database, ignoring rows hidden by filters. For instance,
=SUBTOTAL(9, Table1[Column1])will sum all visible values in Column1. - PivotTable: While not a function, PivotTables are powerful tools for summarizing, analyzing, exploring, and presenting data. You can create a PivotTable from your Excel table by selecting the table, going to the "Insert" tab, and clicking on "PivotTable."
Using these functions and tools, you can perform comprehensive data analysis within an Excel table, helping you to make more informed decisions based on your data.
The above is the detailed content of how to make a table in excel. For more information, please follow other related articles on the PHP Chinese website!

Hot AI Tools

Undresser.AI Undress
AI-powered app for creating realistic nude photos

AI Clothes Remover
Online AI tool for removing clothes from photos.

Undress AI Tool
Undress images for free

Clothoff.io
AI clothes remover

AI Hentai Generator
Generate AI Hentai for free.

Hot Article
Hot Tools

Notepad++7.3.1
Easy-to-use and free code editor

SublimeText3 Chinese version
Chinese version, very easy to use

Zend Studio 13.0.1
Powerful PHP integrated development environment

Dreamweaver CS6
Visual web development tools

SublimeText3 Mac version
God-level code editing software (SublimeText3)
Hot Topics
 1377
1377
 52
52

 How to create timeline in Excel to filter pivot tables and charts
Mar 22, 2025 am 11:20 AM
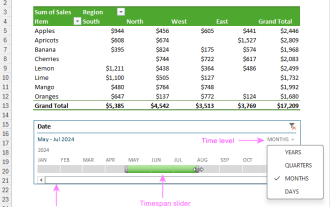
How to create timeline in Excel to filter pivot tables and charts
Mar 22, 2025 am 11:20 AM
This article will guide you through the process of creating a timeline for Excel pivot tables and charts and demonstrate how you can use it to interact with your data in a dynamic and engaging way. You've got your data organized in a pivo
 how to sum a column in excel
Mar 14, 2025 pm 02:42 PM
how to sum a column in excel
Mar 14, 2025 pm 02:42 PM
The article discusses methods to sum columns in Excel using the SUM function, AutoSum feature, and how to sum specific cells.
 how to make a table in excel
Mar 14, 2025 pm 02:53 PM
how to make a table in excel
Mar 14, 2025 pm 02:53 PM
Article discusses creating, formatting, and customizing tables in Excel, and using functions like SUM, AVERAGE, and PivotTables for data analysis.
 Excel formula to find top 3, 5, 10 values in column or row
Apr 01, 2025 am 05:09 AM
Excel formula to find top 3, 5, 10 values in column or row
Apr 01, 2025 am 05:09 AM
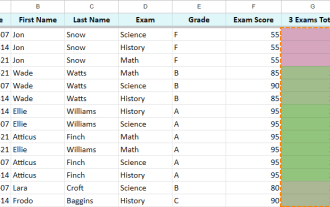
This tutorial demonstrates how to efficiently locate the top N values within a dataset and retrieve associated data using Excel formulas. Whether you need the highest, lowest, or those meeting specific criteria, this guide provides solutions. Findi
 how to make pie chart in excel
Mar 14, 2025 pm 03:32 PM
how to make pie chart in excel
Mar 14, 2025 pm 03:32 PM
The article details steps to create and customize pie charts in Excel, focusing on data preparation, chart insertion, and personalization options for enhanced visual analysis.
 how to calculate mean in excel
Mar 14, 2025 pm 03:33 PM
how to calculate mean in excel
Mar 14, 2025 pm 03:33 PM
Article discusses calculating mean in Excel using AVERAGE function. Main issue is how to efficiently use this function for different data sets.(158 characters)
 how to add drop down in excel
Mar 14, 2025 pm 02:51 PM
how to add drop down in excel
Mar 14, 2025 pm 02:51 PM
Article discusses creating, editing, and removing drop-down lists in Excel using data validation. Main issue: how to manage drop-down lists effectively.
 All you need to know to sort any data in Google Sheets
Mar 22, 2025 am 10:47 AM
All you need to know to sort any data in Google Sheets
Mar 22, 2025 am 10:47 AM
Mastering Google Sheets Sorting: A Comprehensive Guide Sorting data in Google Sheets needn't be complex. This guide covers various techniques, from sorting entire sheets to specific ranges, by color, date, and multiple columns. Whether you're a novi
