

In today's data-driven world, efficient data analysis is paramount for informed decision-making. Python, with its user-friendly syntax and extensive libraries, has become the go-to language for data scientists and analysts. This article highlights ten essential Python libraries for data analysis, catering to both novice and experienced users.
NumPy forms the bedrock of Python's numerical computing capabilities. It excels at handling large, multi-dimensional arrays and matrices, providing a comprehensive suite of mathematical functions for efficient array manipulation.
Strengths:
Limitations:
import numpy as np

data = np.array([1, 2, 3, 4, 5])
print("Array:", data)
print("Mean:", np.mean(data))
print("Standard Deviation:", np.std(data))Output

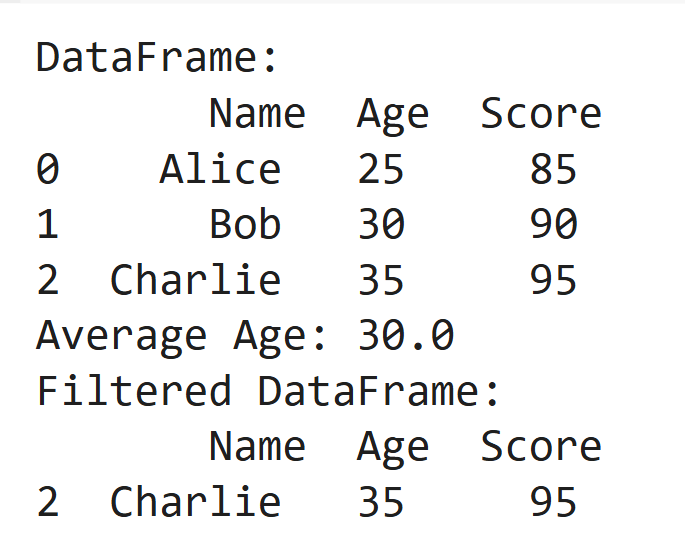
Pandas simplifies data manipulation with its DataFrame structure, ideal for working with tabular data. Cleaning, transforming, and analyzing structured datasets becomes significantly easier with Pandas.
Strengths:
Limitations:
import pandas as pd

data = pd.DataFrame({'Name': ['Alice', 'Bob', 'Charlie'], 'Age': [25, 30, 35], 'Score': [85, 90, 95]})
print("DataFrame:\n", data)
print("Average Age:", data['Age'].mean())
print("Filtered DataFrame:\n", data[data['Score'] > 90])Output
Matplotlib is a versatile plotting library, enabling the creation of a wide range of static, interactive, and even animated visualizations.
Strengths:
Limitations:
import matplotlib.pyplot as plt

x = [1, 2, 3, 4, 5]
y = [2, 4, 6, 8, 10]
plt.plot(x, y, label="Line Plot")
plt.xlabel('X-axis')
plt.ylabel('Y-axis')
plt.title('Matplotlib Example')
plt.legend()
plt.show()Output

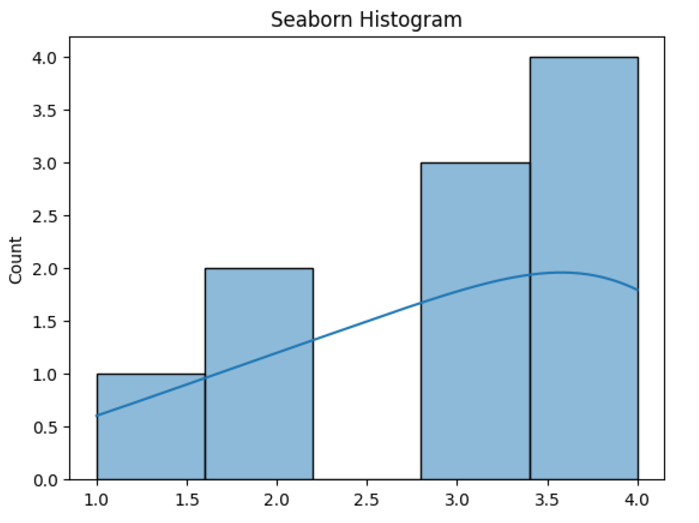
Seaborn builds upon Matplotlib, simplifying the creation of statistically informative and visually appealing plots.
Strengths:
Limitations:
import seaborn as sns
import matplotlib.pyplot as plt

data = [1, 2, 2, 3, 3, 3, 4, 4, 4, 4]
sns.histplot(data, kde=True)
plt.title('Seaborn Histogram')
plt.show()Output
SciPy extends NumPy, offering advanced tools for scientific computing, including optimization, integration, and signal processing.
Strengths:
Limitations:
from scipy.stats import ttest_ind

group1 = [1, 2, 3, 4, 5]
group2 = [2, 3, 4, 5, 6]
t_stat, p_value = ttest_ind(group1, group2)
print("T-Statistic:", t_stat)
print("P-Value:", p_value)Output

Scikit-learn is a powerful machine learning library, providing tools for classification, regression, clustering, and dimensionality reduction.
Strengths:
Limitations:
from sklearn.linear_model import LinearRegression

X = [[1], [2], [3], [4]]
y = [2, 4, 6, 8]
model = LinearRegression()
model.fit(X, y)
print("Prediction for X=5:", model.predict([[5]])[0])Output

Statsmodels focuses on statistical modeling and hypothesis testing, particularly useful for econometrics and statistical research.
Strengths:
Limitations:
import statsmodels.api as sm

X = [1, 2, 3, 4]
y = [2, 4, 6, 8]
X = sm.add_constant(X)
model = sm.OLS(y, X).fit()
print(model.summary())
Output

Plotly creates interactive and web-ready visualizations, perfect for dashboards and web applications.
Strengths:
Limitations:
import plotly.express as px

data = px.data.iris()
fig = px.scatter(data, x="sepal_width", y="sepal_length", color="species", title="Iris Dataset Scatter Plot")
fig.show()
Output

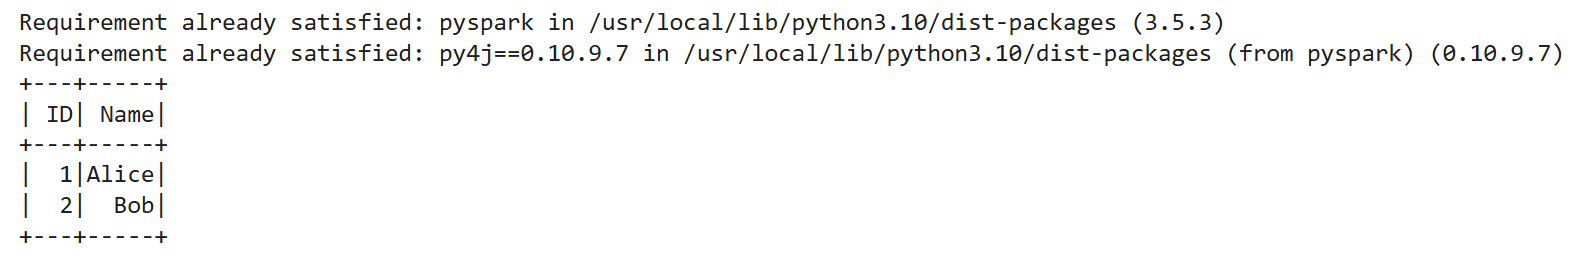
PySpark provides a Python interface to Apache Spark, enabling distributed computing for large-scale data processing.
Strengths:
Limitations:
!pip install pyspark
from pyspark.sql import SparkSession

spark = SparkSession.builder.appName("PySpark Example").getOrCreate()
data = spark.createDataFrame([(1, "Alice"), (2, "Bob")], ["ID", "Name"])
data.show()Output
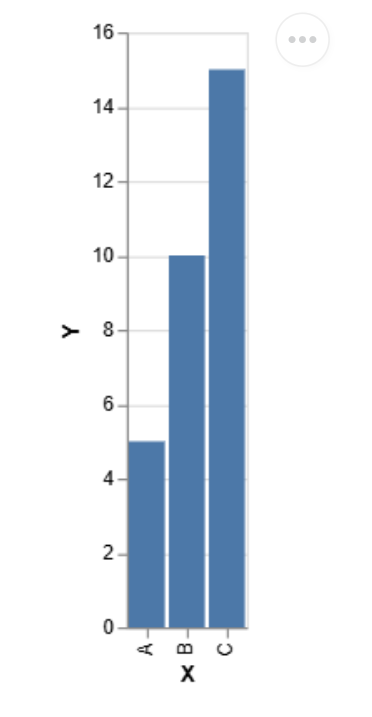
Altair is a declarative visualization library based on Vega and Vega-Lite, offering a concise syntax for creating sophisticated plots.
Strengths:
Limitations:
import altair as alt
import pandas as pd

data = pd.DataFrame({'X': ['A', 'B', 'C'], 'Y': [5, 10, 15]})
chart = alt.Chart(data).mark_bar().encode(x='X', y='Y')
chart.display()Output
Choosing the appropriate library depends on several factors: the nature of your task (data cleaning, visualization, modeling), dataset size, analysis objectives, and your experience level. Consider the strengths and limitations of each library before making your selection.
Python's popularity in data analysis stems from its ease of use, extensive libraries, strong community support, and seamless integration with big data tools.
Python's rich ecosystem of libraries empowers data analysts to tackle diverse challenges, from simple data exploration to complex machine learning tasks. Selecting the right tools for the job is crucial, and this overview provides a solid foundation for choosing the best Python libraries for your data analysis needs.
The above is the detailed content of Top 20 Python Libraries for Data Analysis for 2025. For more information, please follow other related articles on the PHP Chinese website!


![[Web front-end] Node.js quick start](https://img.php.cn/upload/course/000/000/067/662b5d34ba7c0227.png)


