

Color scales in Excel: how to add, use and customize

This tutorial will teach you how to conditionally format cells in Excel using gradient color scales to visually compare values in a range.
Excel conditional formatting is all about visualizing data with colors. You can use contrasting colors to represent data categories or gradients to "map" data with some intrinsic order. When a certain pallet is used to visually represent data, it becomes a color scale.
Color scales in Excel
A color scale is a sequence of smoothly changing colors that represent smaller and larger values. They come in especially handy to visualize relationships between numerical values in large datasets.
A typical example is heat maps that are widely used by analysts for discovering generic patterns and trends in various data types such as air temperatures, stock quotes, incomes, and so on.
There exist three main types of color scales:
- Sequential - gradients of the same hue going from light to dark or the other way round. They are best suited for visualizing numbers that go from low to high. For example, a medium green color says: "this value is a bit higher than the light green but lower than the dark green".
- Diverging, aka bipolar or double-ended - they can be thought of as two opposite facing sequential color schemes combined together. Diverging shades reveal more differences in values than sequential colors. They are perfect for visualizing frequencies, priorities, perceptions, or behavioral changes (e.g. never, rarely, sometimes, often, always).
- Qualitative or categorical - these are a few different colors such as red, blue, green, etc. They work nice for representing data categories that have no inherent order like industries, territories, species, etc.
Microsoft Excel has a number of preset 2-color or 3-color scales, which can be customized to your liking. Also, you can create a custom scale with a palette of your choosing.

How to add color scale in Excel
To add a color scale to your worksheet, follow these steps:
- Select a range of cells that you want to format.
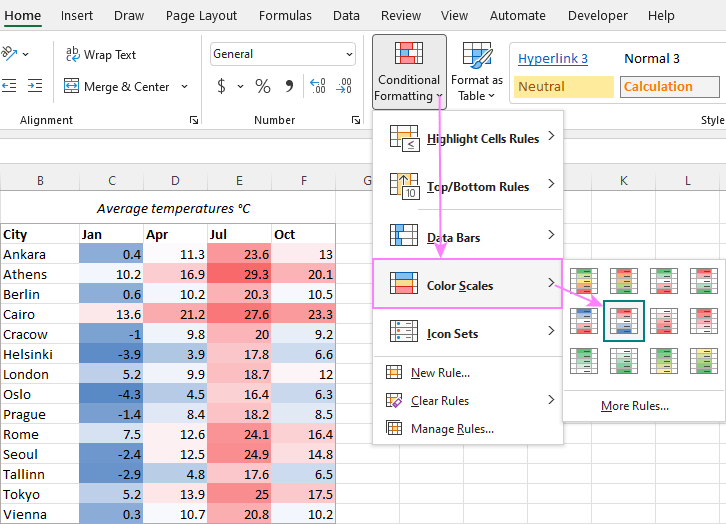
- On the Home tab, in the Styles group, click Conditional Formatting.
- Point to Color Scales and choose the type you want. Done!
For example, here's how you can use a 3-color scale (red-white-blue) to "map" air temperatures:
By default, for 3-color scales, Excel uses the 50th percentile, also known as median or midpoint. The median divides the dataset into two equal parts. Half of the values lie above the median and half are below the median. In our case, the cell that holds the median is colored white, the cell with the maximum value is highlighted in red, and the cell with the minimum value is highlighted in dark blue. All other cells are colored proportionally in different shades of those three main colors.
The default behavior can be changed by editing a preset color scale or creating your own one:
To modify an existing color scale, select any of the formatted cells, click Conditional Formatting > Manage Rule > Edit, and then choose different colors and other options. For more details, see How to edit conditional formatting rules.
To set up a custom color scale, please follow the below example.
How to make custom color scale in Excel
If none of the predefined scales suits your needs, you can create a custom scale in this way:
- Select the cells to be formatted.
- Click Conditional Formatting > Color Scales > More Rules.

- In the New Formatting Rule dialog box, configure these options:
- In the Format Style dropdown box, select either 2-Color Scale (default) or 3-Color Scale.
- For Minimum, Midpoint and Maximum values, pick the data type (Number, Percent, Percentile, or Formula), and then choose the color.
- When done, click OK.

Below is an example of a custom 3-color scale based on percentage:
Minimum is set to 10%. This will color the bottom 10% values in the darkest shade of the color you chose for the minimum value (lilac in this example).
Maximum is set to 90%. This will highlight the top 10% values in the darkest shade of the color chosen for the minimum value (amber in our case).
Midpoint is left default (50th percentile), so the cell containing the median is colored white.

Excel color scale formula
In Microsoft Excel, you would typically use the MIN function to get the lowest value in the dataset, MAX to find the highest value, and MEDIAN to get the midpoint. In conditional formatting color scales, it makes no sense to use these functions as the corresponding values are available in Type dropdown boxes, so you can simply pick them. In some situations, however, you may want to define the threshold values in a different way using other formulas.
In the below example, we have average temperatures for two years in columns B and C. In column D, the percent change formula returns the difference between the values in each row:
=C3/B3 - 1
The differences are conditionally formatted using a 2-color scale based on these formulas:
For Minimum, the SMALL function returns the 3rd smallest value. As a result, the bottom 3 numbers are highlighted in the same shade of beige.
=SMALL($D$3:$D$16, 3)
For Maximum, the LARGE function brings the 3rd highest value. As a result, the top 3 numbers are colored in the same shade of red.
=LARGE($D$3:$D$16, 3)

In a similar manner, you can do conditional formatting with 3-color scale formulas.
How to create 4-color scale and 5-color scale in Excel
Conditional formatting in Excel only provides 2-color and 3-color scales. No preset rules for multi-color scales are available.
To emulate 4-color or 5-color scale, you can create a few separate rules with formulas, one rule per color. Please note, the cells will be formatted with the distinct colors of your choosing and not gradient colors.
Here are the detailed instructions to set up a conditional formatting rule with formula. And here are formula examples to mimic a 5-color scale:
Rule 1 (dark blue): lower than -2
=B3
Rule 2 (light blue): between -2 and 0 inclusive
=AND(B3>=-2, B3
Rule 3 (white): between 0 and 5 exclusive
=AND(B3>0, B3
Rule 4 (light orange): between 5 and 20 inclusive
=AND(B3>=5, B3
Rule 5 (dark orange): higher than 20
=B3>20
The result looks pretty nice, isn't it?

How to show only color scale without values
For color scales, Excel does not provide the Show Scale Only option like it does for Icon Sets and Data Bars. But you can easily hide numbers by applying a special custom number format. The steps are:
- In your conditionally formatted data set, select the values you want to hide.
- Press Ctrl 1 to open the Format Cells dialog box.
- In the Format Cells dialog box, go to the Number tab > Custom, type 3 semicolons (;;;) in the Type box, and click OK.
That's all there is to it! Now, Excel shows only the color scale and hides the numbers:

This is how to add color scales in Excel to visualize data. I thank you for reading and hope to see you on our blog next week!
Practice workbook for download
Using color scales in Excel - examples (.xlsx file)
The above is the detailed content of Color scales in Excel: how to add, use and customize. For more information, please follow other related articles on the PHP Chinese website!

Hot AI Tools

Undresser.AI Undress
AI-powered app for creating realistic nude photos

AI Clothes Remover
Online AI tool for removing clothes from photos.

Undress AI Tool
Undress images for free

Clothoff.io
AI clothes remover

Video Face Swap
Swap faces in any video effortlessly with our completely free AI face swap tool!

Hot Article
Hot Tools

Notepad++7.3.1
Easy-to-use and free code editor

SublimeText3 Chinese version
Chinese version, very easy to use

Zend Studio 13.0.1
Powerful PHP integrated development environment

Dreamweaver CS6
Visual web development tools

SublimeText3 Mac version
God-level code editing software (SublimeText3)
Hot Topics
 1664
1664
 14
1421
52
1315
25
1266
29
1239
24
14
1421
52
1315
25
1266
29
1239
24

 MEDIAN formula in Excel - practical examples
Apr 11, 2025 pm 12:08 PM
MEDIAN formula in Excel - practical examples
Apr 11, 2025 pm 12:08 PM
This tutorial explains how to calculate the median of numerical data in Excel using the MEDIAN function. The median, a key measure of central tendency, identifies the middle value in a dataset, offering a more robust representation of central tenden
 Excel shared workbook: How to share Excel file for multiple users
Apr 11, 2025 am 11:58 AM
Excel shared workbook: How to share Excel file for multiple users
Apr 11, 2025 am 11:58 AM
This tutorial provides a comprehensive guide to sharing Excel workbooks, covering various methods, access control, and conflict resolution. Modern Excel versions (2010, 2013, 2016, and later) simplify collaborative editing, eliminating the need to m
 Google Spreadsheet COUNTIF function with formula examples
Apr 11, 2025 pm 12:03 PM
Google Spreadsheet COUNTIF function with formula examples
Apr 11, 2025 pm 12:03 PM
Master Google Sheets COUNTIF: A Comprehensive Guide This guide explores the versatile COUNTIF function in Google Sheets, demonstrating its applications beyond simple cell counting. We'll cover various scenarios, from exact and partial matches to han
 Excel: If cell contains formula examples
Apr 09, 2025 am 09:04 AM
Excel: If cell contains formula examples
Apr 09, 2025 am 09:04 AM
This tutorial demonstrates various Excel formulas to check if a cell contains specific values, including text, numbers, or parts of strings. It covers scenarios using IF, ISTEXT, ISNUMBER, SEARCH, FIND, COUNTIF, EXACT, SUMPRODUCT, VLOOKUP, and neste
 How to convert Excel to JPG - save .xls or .xlsx as image file
Apr 11, 2025 am 11:31 AM
How to convert Excel to JPG - save .xls or .xlsx as image file
Apr 11, 2025 am 11:31 AM
This tutorial explores various methods for converting .xls files to .jpg images, encompassing both built-in Windows tools and free online converters. Need to create a presentation, share spreadsheet data securely, or design a document? Converting yo
 Google sheets chart tutorial: how to create charts in google sheets
Apr 11, 2025 am 09:06 AM
Google sheets chart tutorial: how to create charts in google sheets
Apr 11, 2025 am 09:06 AM
This tutorial shows you how to create various charts in Google Sheets, choosing the right chart type for different data scenarios. You'll also learn how to create 3D and Gantt charts, and how to edit, copy, and delete charts. Visualizing data is cru
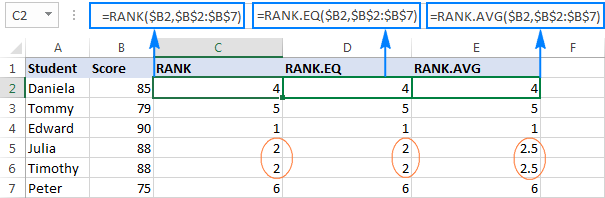 Excel RANK function and other ways to calculate rank
Apr 09, 2025 am 11:35 AM
Excel RANK function and other ways to calculate rank
Apr 09, 2025 am 11:35 AM
This Excel tutorial details the nuances of the RANK functions and demonstrates how to rank data in Excel based on multiple criteria, group data, calculate percentile rank, and more. Determining the relative position of a number within a list is easi
 How to flip data in Excel columns and rows (vertically and horizontally)
Apr 11, 2025 am 09:05 AM
How to flip data in Excel columns and rows (vertically and horizontally)
Apr 11, 2025 am 09:05 AM
This tutorial demonstrates several efficient methods for vertically and horizontally flipping tables in Excel, preserving original formatting and formulas. While Excel lacks a direct "flip" function, several workarounds exist. Flipping Dat
