
 Database
Mysql Tutorial
How does the InnoDB buffer pool work? How can you tune it for optimal performance?
Database
Mysql Tutorial
How does the InnoDB buffer pool work? How can you tune it for optimal performance?
How does the InnoDB buffer pool work? How can you tune it for optimal performance?

How does the InnoDB buffer pool work? How can you tune it for optimal performance?
The InnoDB buffer pool is a crucial part of the MySQL database system that manages and caches data and indexes in memory to reduce disk I/O operations, thereby enhancing performance. The buffer pool is used to store both data pages and index pages, allowing quick access to data without the need for slower disk access.
How it Works:
- Data Caching: When a request for data is made, InnoDB first checks if the requested data page is in the buffer pool. If it is, InnoDB retrieves the data from the memory (buffer pool) instead of the disk, which is much faster.
- Index Caching: Similarly, index pages are stored in the buffer pool. This allows for faster index lookups and reduces the need to read index pages from disk.
- Dirty Pages: When data in the buffer pool is modified, it becomes a "dirty page." These changes are periodically written back to disk in a process known as flushing.
- LRU Algorithm: The buffer pool uses a Least Recently Used (LRU) algorithm to manage its contents. Pages that are accessed less frequently are moved to the tail of the LRU list and may be evicted to make room for new pages.
Tuning for Optimal Performance:
-
Buffer Pool Size: The most critical tuning parameter is the
innodb_buffer_pool_size. This should be set to a value that allows most of your working set to fit in memory. A common recommendation is to allocate up to 70-80% of the server's total memory to the buffer pool, depending on other memory requirements. -
Multiple Buffer Pool Instances: For systems with high concurrency, setting
innodb_buffer_pool_instancesto a value greater than 1 can help reduce contention among threads accessing the buffer pool. -
LRU Algorithm Tuning: The
innodb_old_blocks_timeparameter can be adjusted to control how quickly new pages are considered "old" and moved to the mid-point of the LRU list, which can help prevent frequently accessed pages from being evicted too soon. -
Flush Settings: Parameters like
innodb_max_dirty_pages_pctandinnodb_io_capacitycan be tuned to control how aggressively dirty pages are flushed to disk, balancing performance and data safety.
What are the key components of the InnoDB buffer pool and their functions?
The InnoDB buffer pool consists of several key components, each serving a specific function to optimize database performance:
- Data Pages: These are the actual data records stored in the buffer pool. They are cached to reduce the need for disk I/O when data is frequently accessed.
- Index Pages: These contain the index structures used for quick data retrieval. Caching index pages in the buffer pool speeds up query execution by reducing the need to read indexes from disk.
- LRU List: The Least Recently Used (LRU) list manages the pages in the buffer pool. It is divided into a "new" sublist and an "old" sublist. Pages that are accessed are moved to the "new" sublist, while less frequently accessed pages are moved to the "old" sublist and may be evicted to make room for new pages.
- Free List: This list contains pages that are available for new data to be loaded into the buffer pool. When a page is needed, it is taken from the free list if available.
- Flush List: The flush list contains "dirty pages" that have been modified in the buffer pool but not yet written back to disk. The flush list helps manage the process of writing these changes to disk.
- Control Blocks: Each page in the buffer pool has an associated control block that contains metadata about the page, such as its position in the LRU list and whether it is dirty.
How does adjusting the InnoDB buffer pool size impact database performance?
Adjusting the InnoDB buffer pool size can have a significant impact on database performance:
- Increased Performance with Larger Size: A larger buffer pool size allows more data and index pages to be cached in memory, reducing the need for disk I/O. This can lead to faster query execution and overall improved performance, especially for read-heavy workloads.
- Diminishing Returns: There is a point of diminishing returns where increasing the buffer pool size beyond what is necessary to hold the working set does not yield significant performance improvements. Allocating too much memory to the buffer pool can also starve other processes of memory, potentially degrading overall system performance.
- Impact on Write Performance: A larger buffer pool can also affect write performance. With more memory available, more dirty pages can accumulate before being flushed to disk, which can lead to longer flush times and potential performance bottlenecks if not managed properly.
- Memory Constraints: On systems with limited memory, increasing the buffer pool size may lead to memory pressure, causing the operating system to swap memory to disk, which can severely degrade performance.
What tools or methods can be used to monitor the effectiveness of the InnoDB buffer pool?
Several tools and methods can be used to monitor the effectiveness of the InnoDB buffer pool:
-
MySQL Performance Schema: The Performance Schema provides detailed information about the buffer pool, including the number of pages in the buffer pool, the number of dirty pages, and the hit ratio. You can access this data using SQL queries.
SELECT * FROM performance_schema.global_status WHERE VARIABLE_NAME LIKE 'Innodb_buffer_pool%';
Copy after login InnoDB Buffer Pool Information Schema: The
INNODB_BUFFER_POOL_STATStable in the Information Schema provides detailed statistics about the buffer pool, such as the number of pages in the LRU list, the number of pages modified, and the number of pages read from disk.SELECT * FROM INFORMATION_SCHEMA.INNODB_BUFFER_POOL_STATS;
Copy after loginMySQL Command Line: The
SHOW ENGINE INNODB STATUScommand provides a comprehensive status report that includes buffer pool statistics, such as the number of pages in the buffer pool, the number of pages read and written, and the hit ratio.SHOW ENGINE INNODB STATUS;
Copy after login- Monitoring Tools: Third-party monitoring tools like Percona Monitoring and Management (PMM), MySQL Enterprise Monitor, and Prometheus with Grafana can provide real-time monitoring and visualization of buffer pool metrics. These tools can help identify trends and potential issues with buffer pool performance.
-
Custom Scripts: You can write custom scripts to periodically collect and analyze buffer pool metrics, such as the buffer pool hit ratio, which is calculated as
(1 - (Innodb_buffer_pool_reads / Innodb_buffer_pool_read_requests)) * 100. A high hit ratio indicates effective use of the buffer pool.
By using these tools and methods, you can gain insights into the performance of the InnoDB buffer pool and make informed decisions about tuning and optimization.
The above is the detailed content of How does the InnoDB buffer pool work? How can you tune it for optimal performance?. For more information, please follow other related articles on the PHP Chinese website!

Hot AI Tools

Undresser.AI Undress
AI-powered app for creating realistic nude photos

AI Clothes Remover
Online AI tool for removing clothes from photos.

Undress AI Tool
Undress images for free

Clothoff.io
AI clothes remover

Video Face Swap
Swap faces in any video effortlessly with our completely free AI face swap tool!

Hot Article
Hot Tools

Notepad++7.3.1
Easy-to-use and free code editor

SublimeText3 Chinese version
Chinese version, very easy to use

Zend Studio 13.0.1
Powerful PHP integrated development environment

Dreamweaver CS6
Visual web development tools

SublimeText3 Mac version
God-level code editing software (SublimeText3)
Hot Topics
 1392
1392
 52
52

 When might a full table scan be faster than using an index in MySQL?
Apr 09, 2025 am 12:05 AM
When might a full table scan be faster than using an index in MySQL?
Apr 09, 2025 am 12:05 AM
Full table scanning may be faster in MySQL than using indexes. Specific cases include: 1) the data volume is small; 2) when the query returns a large amount of data; 3) when the index column is not highly selective; 4) when the complex query. By analyzing query plans, optimizing indexes, avoiding over-index and regularly maintaining tables, you can make the best choices in practical applications.
 Explain InnoDB Full-Text Search capabilities.
Apr 02, 2025 pm 06:09 PM
Explain InnoDB Full-Text Search capabilities.
Apr 02, 2025 pm 06:09 PM
InnoDB's full-text search capabilities are very powerful, which can significantly improve database query efficiency and ability to process large amounts of text data. 1) InnoDB implements full-text search through inverted indexing, supporting basic and advanced search queries. 2) Use MATCH and AGAINST keywords to search, support Boolean mode and phrase search. 3) Optimization methods include using word segmentation technology, periodic rebuilding of indexes and adjusting cache size to improve performance and accuracy.
 Can I install mysql on Windows 7
Apr 08, 2025 pm 03:21 PM
Can I install mysql on Windows 7
Apr 08, 2025 pm 03:21 PM
Yes, MySQL can be installed on Windows 7, and although Microsoft has stopped supporting Windows 7, MySQL is still compatible with it. However, the following points should be noted during the installation process: Download the MySQL installer for Windows. Select the appropriate version of MySQL (community or enterprise). Select the appropriate installation directory and character set during the installation process. Set the root user password and keep it properly. Connect to the database for testing. Note the compatibility and security issues on Windows 7, and it is recommended to upgrade to a supported operating system.
 Difference between clustered index and non-clustered index (secondary index) in InnoDB.
Apr 02, 2025 pm 06:25 PM
Difference between clustered index and non-clustered index (secondary index) in InnoDB.
Apr 02, 2025 pm 06:25 PM
The difference between clustered index and non-clustered index is: 1. Clustered index stores data rows in the index structure, which is suitable for querying by primary key and range. 2. The non-clustered index stores index key values and pointers to data rows, and is suitable for non-primary key column queries.
 MySQL: Simple Concepts for Easy Learning
Apr 10, 2025 am 09:29 AM
MySQL: Simple Concepts for Easy Learning
Apr 10, 2025 am 09:29 AM
MySQL is an open source relational database management system. 1) Create database and tables: Use the CREATEDATABASE and CREATETABLE commands. 2) Basic operations: INSERT, UPDATE, DELETE and SELECT. 3) Advanced operations: JOIN, subquery and transaction processing. 4) Debugging skills: Check syntax, data type and permissions. 5) Optimization suggestions: Use indexes, avoid SELECT* and use transactions.
 The relationship between mysql user and database
Apr 08, 2025 pm 07:15 PM
The relationship between mysql user and database
Apr 08, 2025 pm 07:15 PM
In MySQL database, the relationship between the user and the database is defined by permissions and tables. The user has a username and password to access the database. Permissions are granted through the GRANT command, while the table is created by the CREATE TABLE command. To establish a relationship between a user and a database, you need to create a database, create a user, and then grant permissions.
 Can mysql and mariadb coexist
Apr 08, 2025 pm 02:27 PM
Can mysql and mariadb coexist
Apr 08, 2025 pm 02:27 PM
MySQL and MariaDB can coexist, but need to be configured with caution. The key is to allocate different port numbers and data directories to each database, and adjust parameters such as memory allocation and cache size. Connection pooling, application configuration, and version differences also need to be considered and need to be carefully tested and planned to avoid pitfalls. Running two databases simultaneously can cause performance problems in situations where resources are limited.
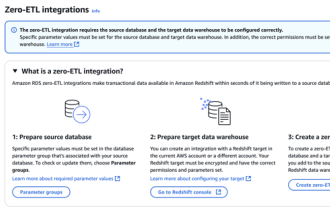 RDS MySQL integration with Redshift zero ETL
Apr 08, 2025 pm 07:06 PM
RDS MySQL integration with Redshift zero ETL
Apr 08, 2025 pm 07:06 PM
Data Integration Simplification: AmazonRDSMySQL and Redshift's zero ETL integration Efficient data integration is at the heart of a data-driven organization. Traditional ETL (extract, convert, load) processes are complex and time-consuming, especially when integrating databases (such as AmazonRDSMySQL) with data warehouses (such as Redshift). However, AWS provides zero ETL integration solutions that have completely changed this situation, providing a simplified, near-real-time solution for data migration from RDSMySQL to Redshift. This article will dive into RDSMySQL zero ETL integration with Redshift, explaining how it works and the advantages it brings to data engineers and developers.
