

How to create a table in Excel

This tutorial provides a comprehensive guide to using Excel tables, outlining their benefits and demonstrating how to create, format, and manage them effectively. Unlike simple data ranges, Excel tables offer dynamic features for efficient data manipulation.
Excel Tables: Beyond Basic Organization
While seemingly just a way to arrange data, Excel tables unlock powerful functionalities. Manage large datasets—hundreds or thousands of rows and columns—with ease, performing instant calculations, sorting, filtering, updates, and summarization using pivot tables. Exporting data is also simplified.
Key Features of Excel Tables:
- Dynamic Nature: Tables automatically expand or contract as data is added or removed.
- Built-in Sorting and Filtering: Quickly sort and filter data, enhanced by visual filtering with slicers.
- Simplified Formatting: Utilize pre-defined table styles for consistent and attractive formatting.
- Always-Visible Headings: Column headers remain visible even when scrolling.
- Quick Totals: Instantly calculate sums, counts, averages, minimums, and maximums.
- Calculated Columns: Easily compute entire columns with a single formula entry.
- Clear Formulas: Use structured references (table and column names) for more readable formulas.
- Dynamic Charts: Charts automatically update as table data changes.

Creating an Excel Table: A Step-by-Step Guide
To transform a data range into a table:
- Select a cell within your data.
- Navigate to the Insert tab, locate the Tables group, and click the Table button (or use the Ctrl T shortcut).
- The Create Table dialog box appears; verify the selected range and check the "My table has headers" box if applicable.
- Click OK.

The result is a formatted table ready for advanced features.

Tips for Table Creation:
- Data Preparation: Clean your data beforehand—remove blank rows, use unique column names, and ensure each row represents a single record.
- Formatting: Remove existing formatting (background colors, etc.) before applying a table style to avoid conflicts.
- Multiple Tables: Create multiple tables on a single sheet as needed, separating them with blank rows and columns for clarity.
Styling Your Excel Table
While the default style is convenient, you can choose a specific style:
- Select a cell in your data.
- On the Home tab, in the Styles group, click Format as Table.
- Select your preferred style from the gallery.
- In the Create Table dialog box, adjust the range and check "My table has headers" as needed. Click OK.

To apply a style and remove all existing formatting simultaneously, right-click the style and select "Apply and Clear Formatting".
Naming Your Excel Table
Excel automatically assigns names (Table1, Table2, etc.). For better organization, rename your tables:
- Select a cell within the table.
- On the Table Design tab, in the Properties group, modify the name in the Table Name box.

Use Ctrl F3 to access the Name Manager and view all table names in the workbook.
Utilizing Excel Table Features
Excel tables provide several powerful features:
Filtering:
- Click the drop-down arrow in a column header.
- Uncheck data to exclude it, or uncheck "Select All" and then check desired data.
- Use "Filter by Color" and "Text Filters" options as needed.
- Click OK.

To remove filter arrows, uncheck "Filter Button" on the Design tab or use Ctrl Shift L. Add slicers for visual filtering via the Insert Slicer button.

Sorting: Click the drop-down arrow in a header to sort by that column.

Formulas (Structured References): Excel tables utilize structured references in formulas, offering advantages in ease of creation, readability, automatic updates, and dynamic adjustments.

Summing Table Columns (Total Row):
- Select a table cell.
- On the Design tab, check the Total Row box.

This adds a total row, using the SUBTOTAL function to sum only visible rows. Choose other functions (COUNT, AVERAGE, etc.) from the drop-down menu in the total row cell.

Use Ctrl Shift T to toggle the Total Row.
Extending Tables: Tables automatically expand when data is entered in adjacent cells. Manually extend by dragging the bottom-right corner handle, or use the Resize Table command on the Design tab.


Managing Table Styles
Excel provides a gallery of table styles. To change a style:
- Select a table cell.
- On the Design tab, choose a style from the Table Styles group.

Right-click a style to set it as default or apply it while clearing existing formatting. Manage banded rows and columns via checkboxes in the Table Style Options group.

Removing Table Formatting and Tables
To remove only the table's built-in formatting, click More in the Table Styles group and select "Clear" or the "None" style. To remove all formatting, use the Clear Formats command on the Home tab.

To remove a table entirely, right-click a table cell, select Table > Convert to Range, and click Yes in the confirmation dialog.

This comprehensive guide empowers you to leverage the full potential of Excel tables for efficient data management.
The above is the detailed content of How to create a table in Excel. For more information, please follow other related articles on the PHP Chinese website!

Hot AI Tools

Undresser.AI Undress
AI-powered app for creating realistic nude photos

AI Clothes Remover
Online AI tool for removing clothes from photos.

Undress AI Tool
Undress images for free

Clothoff.io
AI clothes remover

AI Hentai Generator
Generate AI Hentai for free.

Hot Article
Hot Tools

Notepad++7.3.1
Easy-to-use and free code editor

SublimeText3 Chinese version
Chinese version, very easy to use

Zend Studio 13.0.1
Powerful PHP integrated development environment

Dreamweaver CS6
Visual web development tools

SublimeText3 Mac version
God-level code editing software (SublimeText3)
Hot Topics
 1377
1377
 52
52

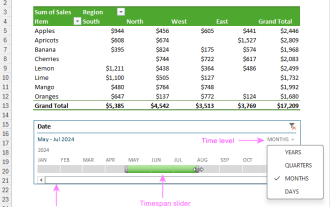 How to create timeline in Excel to filter pivot tables and charts
Mar 22, 2025 am 11:20 AM
How to create timeline in Excel to filter pivot tables and charts
Mar 22, 2025 am 11:20 AM
This article will guide you through the process of creating a timeline for Excel pivot tables and charts and demonstrate how you can use it to interact with your data in a dynamic and engaging way. You've got your data organized in a pivo
 how to sum a column in excel
Mar 14, 2025 pm 02:42 PM
how to sum a column in excel
Mar 14, 2025 pm 02:42 PM
The article discusses methods to sum columns in Excel using the SUM function, AutoSum feature, and how to sum specific cells.
 how to make pie chart in excel
Mar 14, 2025 pm 03:32 PM
how to make pie chart in excel
Mar 14, 2025 pm 03:32 PM
The article details steps to create and customize pie charts in Excel, focusing on data preparation, chart insertion, and personalization options for enhanced visual analysis.
 how to make a table in excel
Mar 14, 2025 pm 02:53 PM
how to make a table in excel
Mar 14, 2025 pm 02:53 PM
Article discusses creating, formatting, and customizing tables in Excel, and using functions like SUM, AVERAGE, and PivotTables for data analysis.
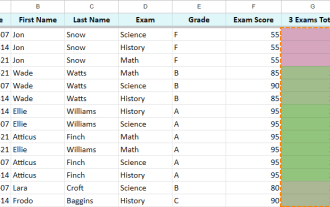
 Excel formula to find top 3, 5, 10 values in column or row
Apr 01, 2025 am 05:09 AM
Excel formula to find top 3, 5, 10 values in column or row
Apr 01, 2025 am 05:09 AM
This tutorial demonstrates how to efficiently locate the top N values within a dataset and retrieve associated data using Excel formulas. Whether you need the highest, lowest, or those meeting specific criteria, this guide provides solutions. Findi
 how to calculate mean in excel
Mar 14, 2025 pm 03:33 PM
how to calculate mean in excel
Mar 14, 2025 pm 03:33 PM
Article discusses calculating mean in Excel using AVERAGE function. Main issue is how to efficiently use this function for different data sets.(158 characters)
 how to add drop down in excel
Mar 14, 2025 pm 02:51 PM
how to add drop down in excel
Mar 14, 2025 pm 02:51 PM
Article discusses creating, editing, and removing drop-down lists in Excel using data validation. Main issue: how to manage drop-down lists effectively.
 All you need to know to sort any data in Google Sheets
Mar 22, 2025 am 10:47 AM
All you need to know to sort any data in Google Sheets
Mar 22, 2025 am 10:47 AM
Mastering Google Sheets Sorting: A Comprehensive Guide Sorting data in Google Sheets needn't be complex. This guide covers various techniques, from sorting entire sheets to specific ranges, by color, date, and multiple columns. Whether you're a novi
