

Linear regression analysis in Excel

This tutorial explains the fundamentals of regression analysis and demonstrates several methods for performing linear regression in Excel. Imagine needing to predict your company's sales for next year, considering numerous influencing factors. Regression analysis helps determine which factors are significant, their interrelationships, and the reliability of predictions.
- Regression Analysis in Excel
- Linear Regression with Analysis ToolPak
- Creating a Linear Regression Graph
- Linear Regression using Formulas
Regression Analysis Basics
Regression analysis estimates relationships between variables:
- Dependent Variable: The primary factor to predict (e.g., sales).
- Independent Variables: Factors influencing the dependent variable (e.g., rainfall, advertising spend).
The analysis reveals how changes in independent variables affect the dependent variable. The model minimizes the sum of squares—a measure of data point dispersion—to find the best-fitting line.
Simple linear regression models the relationship between one independent and one dependent variable using a linear function. Multiple linear regression uses two or more independent variables. Nonlinear regression is used when the relationship isn't linear. This tutorial focuses on simple linear regression.
For example, analyzing 24 months of umbrella sales data against monthly rainfall reveals their relationship:

Linear Regression Equation
The linear regression equation is:
y = bx a ε
Where:
-
xis the independent variable. -
yis the dependent variable. -
ais the Y-intercept (the value of y when x=0). -
bis the slope (the change in y for a unit change in x). -
εis the random error term (the difference between actual and predicted y values).
Excel's linear regression uses the least squares method to find a and b, omitting the explicit error term calculation:
y = bx a
For our example: Umbrellas Sold = b * Rainfall a
Several methods exist to find a and b in Excel:
- Analysis ToolPak
- Scatter chart with trendline
- Formulas (LINEST, SLOPE, INTERCEPT)
Linear Regression with Analysis ToolPak
This method uses Excel's Analysis ToolPak add-in.
Enabling Analysis ToolPak:
- Go to File > Options.
- Select Add-ins in the left sidebar. Choose Excel Add-ins in the Manage box and click Go.
- Check Analysis ToolPak and click OK. This adds the Data Analysis tool to the Data tab.
Performing Regression Analysis:
Assume rainfall data is in column B and umbrella sales in column C.
- Go to the Data tab and click Data Analysis.
- Select Regression and click OK.
- In the Regression dialog box:
- Input Y Range: Select your dependent variable (umbrella sales, e.g., C1:C25).
- Input X Range: Select your independent variable (rainfall, e.g., B1:B25).
- Check Labels if you have headers.
- Choose an output option (e.g., a new worksheet).
- Optionally, check Residuals.
- Click OK.
Interpreting the Output:
The output includes:
-
Summary Output: Provides statistics like Multiple R (correlation coefficient), R Square (coefficient of determination), Adjusted R Square, Standard Error, and Observations. A higher R Square (closer to 1) indicates a better fit.
-
ANOVA: Performs an analysis of variance to test the overall significance of the model. The Significance F value (p-value) should be less than 0.05 for a statistically significant model.
-
Coefficients: Provides the intercept (
a) and slope (b) for the regression equation. -
Residuals: Shows the difference between actual and predicted values.
Creating a Linear Regression Graph
- Select both data columns (including headers).
- Go to the Insert tab and choose a Scatter chart.
- Right-click on a data point and select Add Trendline.
- Choose Linear and check Display Equation on chart.
- Customize the line appearance as needed.
Linear Regression using Formulas
Excel functions can perform linear regression:
-
LINEST(y_range, x_range): Returns an array containing the slope and intercept. Must be entered as an array formula (Ctrl Shift Enter). -
SLOPE(y_range, x_range): Returns the slope (b). -
INTERCEPT(y_range, x_range): Returns the y-intercept (a). -
CORREL(y_range, x_range): Returns the correlation coefficient.
Conclusion
While Excel offers tools for linear regression, specialized statistical software may be necessary for complex analyses. This tutorial provides a foundation for understanding and applying linear regression in Excel.
The above is the detailed content of Linear regression analysis in Excel. For more information, please follow other related articles on the PHP Chinese website!

Hot AI Tools

Undresser.AI Undress
AI-powered app for creating realistic nude photos

AI Clothes Remover
Online AI tool for removing clothes from photos.

Undress AI Tool
Undress images for free

Clothoff.io
AI clothes remover

Video Face Swap
Swap faces in any video effortlessly with our completely free AI face swap tool!

Hot Article
Hot Tools

Notepad++7.3.1
Easy-to-use and free code editor

SublimeText3 Chinese version
Chinese version, very easy to use

Zend Studio 13.0.1
Powerful PHP integrated development environment

Dreamweaver CS6
Visual web development tools

SublimeText3 Mac version
God-level code editing software (SublimeText3)
Hot Topics


 Excel formula to find top 3, 5, 10 values in column or row
Apr 01, 2025 am 05:09 AM
Excel formula to find top 3, 5, 10 values in column or row
Apr 01, 2025 am 05:09 AM
This tutorial demonstrates how to efficiently locate the top N values within a dataset and retrieve associated data using Excel formulas. Whether you need the highest, lowest, or those meeting specific criteria, this guide provides solutions. Findi
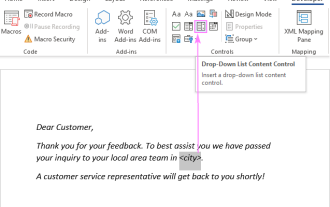 Add a dropdown list to Outlook email template
Apr 01, 2025 am 05:13 AM
Add a dropdown list to Outlook email template
Apr 01, 2025 am 05:13 AM
This tutorial shows you how to add dropdown lists to your Outlook email templates, including multiple selections and database population. While Outlook doesn't directly support dropdowns, this guide provides creative workarounds. Email templates sav
 How to use Flash Fill in Excel with examples
Apr 05, 2025 am 09:15 AM
How to use Flash Fill in Excel with examples
Apr 05, 2025 am 09:15 AM
This tutorial provides a comprehensive guide to Excel's Flash Fill feature, a powerful tool for automating data entry tasks. It covers various aspects, from its definition and location to advanced usage and troubleshooting. Understanding Excel's Fla
 How to add calendar to Outlook: shared, Internet calendar, iCal file
Apr 03, 2025 am 09:06 AM
How to add calendar to Outlook: shared, Internet calendar, iCal file
Apr 03, 2025 am 09:06 AM
This article explains how to access and utilize shared calendars within the Outlook desktop application, including importing iCalendar files. Previously, we covered sharing your Outlook calendar. Now, let's explore how to view calendars shared with
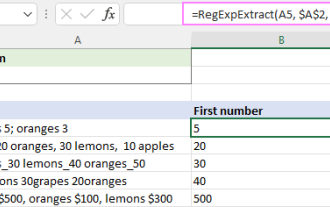 Regex to extract strings in Excel (one or all matches)
Mar 28, 2025 pm 12:19 PM
Regex to extract strings in Excel (one or all matches)
Mar 28, 2025 pm 12:19 PM
In this tutorial, you'll learn how to use regular expressions in Excel to find and extract substrings matching a given pattern. Microsoft Excel provides a number of functions to extract text from cells. Those functions can cope with most
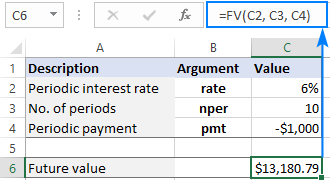 FV function in Excel to calculate future value
Apr 01, 2025 am 04:57 AM
FV function in Excel to calculate future value
Apr 01, 2025 am 04:57 AM
This tutorial explains how to use Excel's FV function to determine the future value of investments, encompassing both regular payments and lump-sum deposits. Effective financial planning hinges on understanding investment growth, and this guide prov
 MEDIAN formula in Excel - practical examples
Apr 11, 2025 pm 12:08 PM
MEDIAN formula in Excel - practical examples
Apr 11, 2025 pm 12:08 PM
This tutorial explains how to calculate the median of numerical data in Excel using the MEDIAN function. The median, a key measure of central tendency, identifies the middle value in a dataset, offering a more robust representation of central tenden
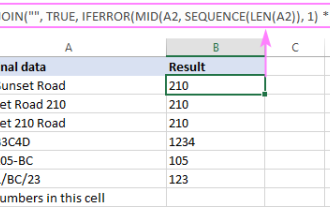 How to remove / split text and numbers in Excel cell
Apr 01, 2025 am 05:07 AM
How to remove / split text and numbers in Excel cell
Apr 01, 2025 am 05:07 AM
This tutorial demonstrates several methods for separating text and numbers within Excel cells, utilizing both built-in functions and custom VBA functions. You'll learn how to extract numbers while removing text, isolate text while discarding numbers
