

Bitcoin (BTC) Price Prediction: Is the Daily Chart Flashing Bearish Warnings?

Bitcoin (BTC) is currently dancing on a razor’s edge near $82,500, and traders are watching nervously. After a period of sideways consolidation, the crypto giant is showing early signs of weakness—raising the question: Is Bitcoin price preparing for a deep drop to $60,000, or is this a bear trap before the next rally? Let's dive into the daily and hourly charts to decode the truth behind BTC's next major move.

Bitcoin (BTC) is currently trading on razor-thin support at $82,500, a level that has seen some volatile action in recent sessions. After a period of sideways consolidation, the crypto giant is showing early signs of weakness. But the question on everyone’s mind is: Is Bitcoin preparing for a substantial drop to $60,000, or is this a bear trap before the next rally?
To better understand BTC’s next major move, let’s examine both the daily and hourly charts closely.
Bitcoin Struggles Below Key Resistances
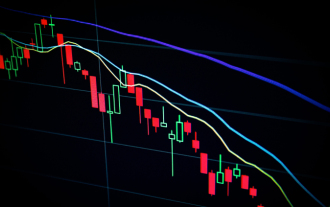
As seen on the daily chart, Heikin Ashi candles are small-bodied and in the red, lacking direction and momentum. Price action remains below major resistances, including the 20 SMA at $84,477, 50 SMA at $86,921, and 100 SMA at $92,808. This alignment suggests a bearish structure where each rally is being sold into.
The failure to reclaim the 100-day SMA multiple times indicates sustained selling pressure, likely from institutions and swing traders. The presence of the 200 SMA below current price around $86,675 had acted as temporary support in March, but it has now turned neutral as price hovers well below it.
The ADL (Accumulation/Distribution Line) has sharply dropped, confirming distribution over accumulation. This means that even during slight upward moves, smart money has been offloading, not adding to positions. Without a turn in the ADL, any bounce is suspect.
Bitcoin Grinds Lower on the 1-Hour Chart
Zooming into the 1-hour chart, Bitcoin is showing a slow, controlled bleed. After peaking briefly around $87K on April 2nd, BTC experienced sharp rejection and has since been forming lower highs. The recent attempt to climb was stopped cleanly at the 200 SMA near $83,300, confirming it as short-term resistance.
The moving averages on the hourly (20, 50, and 100 SMA) are compressing and curving downward, which typically leads to momentum breakdowns, especially when paired with flat volume and fading bullish candles. The most recent Heikin Ashi candles are small-bodied and leaning bearish, showing that the bulls are losing steam and failing to defend even intraday bounces.
The hourly ADL is declining, further confirming the lack of demand at current price levels. Retail interest appears low, and there’s no sign of whale-driven accumulation on this timeframe either.
Key Support and Resistance Levels to Watch
Immediate support lies at $82,000, which has been tested several times over the past few sessions. A decisive break below this level could trigger a sharp selloff down to $78,500, with a psychological and structural support zone around $75,000. If that fails, then the long-feared move toward $69,000–$60,000 could come into play quickly.
On the upside, resistance sits heavy around $84,500, followed by $86,900, both marked by the daily 20 and 50 SMA zones. Only a break above $87,500–$88,000, backed by volume, would confirm a bullish reversal and negate the current bearish setup.
What Do the Indicators Suggest?
The Relative Strength Index (RSI) on the daily chart is approaching oversold territory, indicating that bears have gained a strong foothold in the market.
The MACD on the 1-hour chart has crossed below the signal line, signaling a potential shift in momentum in favor of the bears.
Bitcoin Price Prediction: What’s Next for April?
Short-Term Outlook (Next 48–72 hours): If $82,000 fails, expect a fast drop to $78,000 or lower. If bulls hold the line and reclaim $84,500 with volume, we might see a short-term bounce to $87K.
Mid-Term Outlook (Next 1–2 weeks): Without a break above the 100-day SMA, Bitcoin price is at risk of cascading down to $75,000. Market sentiment is fragile, and macroeconomic news or ETF flows could tip the balance.
Long-Term Outlook (Rest of April 2025): If $75,000 breaks in April, then a full correction down to $60,000 is on the table. However, if bulls manage to regain $90K territory, it could open the door back to $100K.
The Bottom Line
The charts are clearly showing that Bitcoin price is at a critical juncture. The current
The above is the detailed content of Bitcoin (BTC) Price Prediction: Is the Daily Chart Flashing Bearish Warnings?. For more information, please follow other related articles on the PHP Chinese website!

Hot AI Tools

Undresser.AI Undress
AI-powered app for creating realistic nude photos

AI Clothes Remover
Online AI tool for removing clothes from photos.

Undress AI Tool
Undress images for free

Clothoff.io
AI clothes remover

Video Face Swap
Swap faces in any video effortlessly with our completely free AI face swap tool!

Hot Article
Hot Tools

Notepad++7.3.1
Easy-to-use and free code editor

SublimeText3 Chinese version
Chinese version, very easy to use

Zend Studio 13.0.1
Powerful PHP integrated development environment

Dreamweaver CS6
Visual web development tools

SublimeText3 Mac version
God-level code editing software (SublimeText3)
Hot Topics
 1392
1392
 52
36
110
52
36
110

 Qubetics ($TICS): The Revolutionizing AI Crypto
Mar 23, 2025 am 10:08 AM
Qubetics ($TICS): The Revolutionizing AI Crypto
Mar 23, 2025 am 10:08 AM
Cryptocurrency has always been a realm where the cutting edge of technology meets bold ambition, and it's only getting more exciting in the future. As artificial intelligence continues to grow in influence, there are a handful of digital assets that
 Pi Network (PI) Price Falls Despite Successful PiFest 2025 Event
Apr 03, 2025 am 10:08 AM
Pi Network (PI) Price Falls Despite Successful PiFest 2025 Event
Apr 03, 2025 am 10:08 AM
Pi Network recently held PiFest 2025, an event aimed at increasing the token's adoption. Over 125,000 sellers and 58,000 merchants participated
 In Celebration of Pi Day, a Community of Pi Network Enthusiasts Held a Bartering Event in Muntinlupa City
Mar 22, 2025 am 10:02 AM
In Celebration of Pi Day, a Community of Pi Network Enthusiasts Held a Bartering Event in Muntinlupa City
Mar 22, 2025 am 10:02 AM
Pi Network Celebrates Pi Day with a Bartering and Merchant Orientation Event in the Philippines
 Where to download the genuine Ouyi? Official website download. Global
Mar 31, 2025 pm 02:09 PM
Where to download the genuine Ouyi? Official website download. Global
Mar 31, 2025 pm 02:09 PM
Ouyi usually refers to Ouyi OKX. The global way to download Ouyi OKX APP is as follows: 1. Android device: Download the APK file through the official website and install it. 2. iOS device: access the official website through the browser and directly download the APP.
 okx Ouyi Exchange web version enter link click to enter
Mar 31, 2025 pm 06:21 PM
okx Ouyi Exchange web version enter link click to enter
Mar 31, 2025 pm 06:21 PM
1. Enter the web version of okx Euyi Exchange ☜☜☜☜☜☜ Click to save 2. Click the link of okx Euyi Exchange app ☜☜☜☜ Click to save 3. After entering the official website, the clear interface provides a login and registration portal. Users can choose to log in to an existing account or register a new account according to their own situation. Whether it is viewing real-time market conditions, conducting transactions, or managing assets, the OKX web version provides a simple and smooth operating experience, suitable for beginners and veterans. Visit OKX official website now for easy experience
 RUVI AI (RUVI) Token Presale Might 20X After an Explosive Launch
Apr 03, 2025 am 11:08 AM
RUVI AI (RUVI) Token Presale Might 20X After an Explosive Launch
Apr 03, 2025 am 11:08 AM
The crypto market continues to face turbulence, with Cardano (ADA) dropping 12% to $0.64, prompting concern across the altcoin sector.
 What is Ouyi for? What is Ouyi
Apr 01, 2025 pm 03:18 PM
What is Ouyi for? What is Ouyi
Apr 01, 2025 pm 03:18 PM
OKX is a global digital asset trading platform. Its main functions include: 1. Buying and selling digital assets (spot trading), 2. Trading between digital assets, 3. Providing market conditions and data, 4. Providing diversified trading products (such as derivatives), 5. Providing asset value-added services, 6. Convenient asset management.
 BlockDAG Launches Beta Testnet With $200M Raised, Ethereum Approaches $2,000 & Tether Expands Into Media
Apr 03, 2025 am 10:34 AM
BlockDAG Launches Beta Testnet With $200M Raised, Ethereum Approaches $2,000 & Tether Expands Into Media
Apr 03, 2025 am 10:34 AM
Ethereum (ETH) price edges toward resistance, Tether news reveals a €10M media deal, and BlockDAG reaches new milestones with Beta Testnet and growing adoption.