

Excel: Group rows automatically or manually, collapse and expand rows

This tutorial demonstrates how to streamline complex Excel spreadsheets by grouping rows, making data easier to analyze. Learn to quickly hide or show row groups and collapse the entire outline to a specific level.
Large, detailed spreadsheets can be overwhelming. Excel's grouping feature offers a solution, allowing you to collapse and expand rows with similar content for clearer, more concise views.
- Automatic Row Grouping (Outline)
- Manual Row Grouping (Nested Groups)
- Collapsing Rows
- Expanding Rows
- Removing Outlines and Ungrouping
- Advanced Grouping Tips
- Automatic Subtotal Calculation
- Applying Default Styles to Summary Rows
- Selecting and Copying Only Visible Rows
- Hiding/Showing Outline Symbols
- Troubleshooting Missing Outline Symbols
Grouping Rows in Excel
Effective Excel row grouping requires structured worksheets: column headers, no blank rows/columns, and summary rows (subtotals) for each data subset. Once organized, group your data using these methods:
Automatic Row Grouping (Creating an Outline)
For single-level datasets, Excel's automatic grouping is quickest:
- Select a cell within the rows to group.
- Navigate to the Data tab > Outline group, click the arrow below Group, and choose Auto Outline.
That's it!
Example of automatically groupable rows:

The resulting outline, shown below, adds outline bars to the left of column A, clearly separating data levels.

Note: If summary rows are above detail rows, before creating an outline, go to the Data tab > Outline group, click the Outline dialog box launcher, and uncheck Summary rows below detail.

Once the outline is created, hide/show details by clicking the minus  or plus
  signs. Collapse/expand to specific levels using the level buttons
  in the top-left corner. See "Collapsing Rows" for details.
Manual Row Grouping
For multi-level datasets, manual grouping is necessary. Ensure no hidden rows exist before starting.
1. Creating Outer Groups (Level 1)
Select a large data subset, including intermediate summary and detail rows. In the example below, to group data for row 9 (East Total), select rows 2-8.

On the Data tab, in the Outline group, click Group, select Rows, and click OK.

A bar appears, spanning the selected rows:

Repeat for additional outer groups. The example requires another for the North region (rows 10-16).
2. Creating Nested Groups (Level 2)
Select detail rows above the summary row and click Group. For example, select rows 2-3 for the Apples group within East, and rows 5-7 for Oranges. Repeat for North regions.
Result:

Tip: Use Shift Alt Right Arrow to create groups faster.
3. Adding More Levels
Add levels as needed. Adding a Grand Total row requires selecting rows 2-17 and grouping them. This creates four levels: Grand total, Region totals, Item subtotals, and Detail rows.

Collapsing Rows in Excel
Excel grouping allows hiding/showing detail rows and collapsing/expanding the entire outline to a specific level.
Collapsing Rows Within a Group
Click the minus button to collapse a group. Alternatively, select a cell within the group and click Hide Detail on the Data tab.

Collapsing/Expanding the Entire Outline
Click the outline number (top-left) to collapse/expand to a specific level. Level 1 shows minimal data, while higher numbers expand all rows.
Expanding Rows in Excel
To expand a collapsed group, click a cell in the visible summary row and click Show Detail on the Data tab, or click the plus sign .

Removing Outlines in Excel
Remove all groups at once by clearing the outline, or ungroup specific rows.
Removing the Entire Outline
Go to the Data tab > Outline group, click the arrow under Ungroup, and select Clear Outline.

Notes: Removing outlines doesn't delete data. Hidden rows might remain hidden; unhide them using appropriate methods. Undo doesn't work after outline removal; recreate it manually.
Ungrouping Specific Rows
Select rows, go to the Data tab > Outline group, click Ungroup, choose Rows, and click OK. Ungrouping non-adjacent rows requires repeating the process for each group.
Excel Grouping Tips
Automatic Subtotal Calculation
Use the Subtotal command with functions like SUM, COUNT, AVERAGE, etc., to automatically calculate subtotals and create outlines.
Applying Default Excel Styles
Excel predefines styles for summary rows (RowLevel_1, RowLevel_2). Apply these before or after grouping. Check Automatic styles in the Outline dialog box launcher to apply automatically.

Selecting and Copying Only Visible Rows
To select only visible rows, select them with the mouse, then go to Home tab > Editing group, click Find & Select > Go To Special, choose Visible cells only, and click OK.

Hiding and Showing Outline Symbols
Use Ctrl 8 to hide/show outline symbols.
Troubleshooting Missing Outline Symbols
Ensure "Show outline symbols if an outline is applied" is checked in File > Options > Advanced.

This tutorial covers row grouping in Excel. Column grouping follows a similar process.
The above is the detailed content of Excel: Group rows automatically or manually, collapse and expand rows. For more information, please follow other related articles on the PHP Chinese website!

Hot AI Tools

Undresser.AI Undress
AI-powered app for creating realistic nude photos

AI Clothes Remover
Online AI tool for removing clothes from photos.

Undress AI Tool
Undress images for free

Clothoff.io
AI clothes remover

Video Face Swap
Swap faces in any video effortlessly with our completely free AI face swap tool!

Hot Article
Hot Tools

Notepad++7.3.1
Easy-to-use and free code editor

SublimeText3 Chinese version
Chinese version, very easy to use

Zend Studio 13.0.1
Powerful PHP integrated development environment

Dreamweaver CS6
Visual web development tools

SublimeText3 Mac version
God-level code editing software (SublimeText3)
Hot Topics


 Excel formula to find top 3, 5, 10 values in column or row
Apr 01, 2025 am 05:09 AM
Excel formula to find top 3, 5, 10 values in column or row
Apr 01, 2025 am 05:09 AM
This tutorial demonstrates how to efficiently locate the top N values within a dataset and retrieve associated data using Excel formulas. Whether you need the highest, lowest, or those meeting specific criteria, this guide provides solutions. Findi
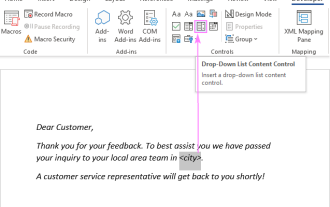 Add a dropdown list to Outlook email template
Apr 01, 2025 am 05:13 AM
Add a dropdown list to Outlook email template
Apr 01, 2025 am 05:13 AM
This tutorial shows you how to add dropdown lists to your Outlook email templates, including multiple selections and database population. While Outlook doesn't directly support dropdowns, this guide provides creative workarounds. Email templates sav
 How to use Flash Fill in Excel with examples
Apr 05, 2025 am 09:15 AM
How to use Flash Fill in Excel with examples
Apr 05, 2025 am 09:15 AM
This tutorial provides a comprehensive guide to Excel's Flash Fill feature, a powerful tool for automating data entry tasks. It covers various aspects, from its definition and location to advanced usage and troubleshooting. Understanding Excel's Fla
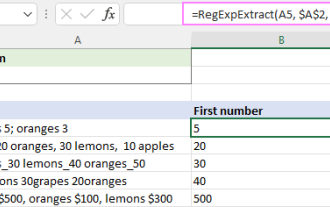 Regex to extract strings in Excel (one or all matches)
Mar 28, 2025 pm 12:19 PM
Regex to extract strings in Excel (one or all matches)
Mar 28, 2025 pm 12:19 PM
In this tutorial, you'll learn how to use regular expressions in Excel to find and extract substrings matching a given pattern. Microsoft Excel provides a number of functions to extract text from cells. Those functions can cope with most
 How to add calendar to Outlook: shared, Internet calendar, iCal file
Apr 03, 2025 am 09:06 AM
How to add calendar to Outlook: shared, Internet calendar, iCal file
Apr 03, 2025 am 09:06 AM
This article explains how to access and utilize shared calendars within the Outlook desktop application, including importing iCalendar files. Previously, we covered sharing your Outlook calendar. Now, let's explore how to view calendars shared with
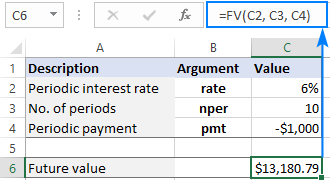 FV function in Excel to calculate future value
Apr 01, 2025 am 04:57 AM
FV function in Excel to calculate future value
Apr 01, 2025 am 04:57 AM
This tutorial explains how to use Excel's FV function to determine the future value of investments, encompassing both regular payments and lump-sum deposits. Effective financial planning hinges on understanding investment growth, and this guide prov
 MEDIAN formula in Excel - practical examples
Apr 11, 2025 pm 12:08 PM
MEDIAN formula in Excel - practical examples
Apr 11, 2025 pm 12:08 PM
This tutorial explains how to calculate the median of numerical data in Excel using the MEDIAN function. The median, a key measure of central tendency, identifies the middle value in a dataset, offering a more robust representation of central tenden
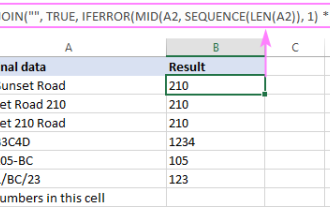 How to remove / split text and numbers in Excel cell
Apr 01, 2025 am 05:07 AM
How to remove / split text and numbers in Excel cell
Apr 01, 2025 am 05:07 AM
This tutorial demonstrates several methods for separating text and numbers within Excel cells, utilizing both built-in functions and custom VBA functions. You'll learn how to extract numbers while removing text, isolate text while discarding numbers
