

Monitor MySQL and MariaDB Droplets with Prometheus MySQL Exporter

有效监控 MySQL 和 MariaDB 数据库对于保持最佳性能、识别潜在瓶颈以及确保整体系统可靠性至关重要。 Prometheus MySQL Exporter 是一款强大的工具,可提供对数据库指标的详细洞察,这对于主动管理和故障排除至关重要。
在本教程中,您将学习如何设置 Prometheus MySQL 导出器使用手动监控 MySQL 和 MariaDB 数据库 配置和基于脚本的自动化。这些方法提供 灵活选择最佳部署策略和运营

方法一-手动配置
我们继续本节的手动配置方法。
添加 Prometheus 系统用户和组
在此步骤中,您将配置目标 Droplet。让我们创建一个名为“prometheus”的系统用户和组来管理导出器服务。
sudo groupadd --system prometheus
sudo useradd -s /sbin/nologin --system -g prometheus prometheus
下载并安装 Prometheus MySQL Exporter
在此步骤中,您将下载最新版本的 Prometheus 来自 GitHub 的 MySQL Exporter,提取下载的文件,并将 二进制文件到 /usr/local/bin/目录。
curl -s https://api.github.com/repos/prometheus/mysqld_exporter/releases/latest | grep browser_download_url | grep linux-amd64 | cut -d '"' -f 4 | wget -qi -
tar xvf mysqld_exporter*.tar.gz
sudo mv mysqld_exporter-*.linux-amd64/mysqld_exporter /usr/local/bin/
sudo chmod x /usr/local/bin/mysqld_exporter
创建Prometheus Exporter 数据库用户
以 root 身份登录 MySQL,并为导出器创建具有必要权限的专用用户。
mysql -u root -p
如果需要,请输入 root 密码,您将请参阅 MySQL/MariaDB 提示符。然后执行以下命令(将下面命令中的giveapassword替换为mysqld_exporter数据库用户的新密码)。
创建一个名为mysqld_exporter的新MySQL用户,密码为本地的giveapassword
CREATE USER 'mysqld_exporter'@'localhost' IDENTIFIED BY 'giveapassword';
授予 mysqld_exporter 用户查看进程列表、客户端复制状态和查询所有数据
GRANT PROCESS, REPLICATION CLIENT, SELECT ON *.* TO 'mysqld_exporter'@'localhost';
重新加载授权表以应用对用户所做的更改权限。
FLUSH PRIVILEGES;
退出 MySQL 命令行
EXIT
配置数据库凭证
创建配置文件来存储MySQL 导出器
sudo vi /etc/.mysqld_exporter.cnf
将以下用户凭据添加到file:
[client]user=mysqld_exporterpassword=giveapassword
设置配置的所有权权限file:
sudo chown root:prometheus /etc/.mysqld_exporter.cnf
创建 systemd 单元文件
创建 systemd 服务单元用于管理 MySQL Exporter 的文件service:
sudo vi /etc/systemd/system/mysql_exporter.service
将以下数据添加到file:
[Unit]Description=Prometheus MySQL ExporterAfter=network.targetUser=prometheusGroup=prometheus[Service]Type=simpleRestart=alwaysExecStart=/usr/local/bin/mysqld_exporter --config.my-cnf /etc/.mysqld_exporter.cnf --collect.global_status --collect.info_schema.innodb_metrics --collect.auto_increment.columns --collect.info_schema.processlist --collect.binlog_size --collect.info_schema.tablestats --collect.global_variables --collect.info_schema.query_response_time --collect.info_schema.userstats --collect.info_schema.tables --collect.perf_schema.tablelocks --collect.perf_schema.file_events --collect.perf_schema.eventswaits --collect.perf_schema.indexiowaits --collect.perf_schema.tableiowaits --collect.slave_status --web.listen-address=0.0.0.0:9104[Install]WantedBy=multi-user.target
重新加载 systemd 并启动 MySQL Exporter 服务
重新加载 systemd配置并启动 MySQL Exporter服务:
sudo systemctl daemon-reload
sudo systemctl enable mysql_exporter
sudo systemctl start mysql_exporter
正在配置Prometheus Droplet
让我们首先备份 prometheus.yml 文件:
cp /etc/prometheus/prometheus.yml /etc/prometheus/prometheus.yml-$(date '%d%b%Y-%H:%M')
现在登录到您的 Prometheus 服务器并添加要抓取的 MySQL Exporter 端点。
将 IP 地址和端口替换为您的 MySQL Exporter 端点(9104 是 Prometheus MySQLd 的默认端口出口商)。
vi /etc/prometheus/prometheus.yml
scrape_configs:
  - job_name: server1_db
    static_configs:
      - targets: ['10.10.1.10:9104']
        labels:
          alias: db1

  - job_name: server2_db
    static_configs:
      - targets: ['10.10.1.11:9104']
        labels:
          alias: db2
方法2-使用脚本进行配置
您还可以通过运行两个脚本来实现这一目标 - 一个用于目标 Droplet,另一个用于 Prometheus Droplet。
让我们从配置目标 Droplet 开始。
第 1 步:通过 SSH 连接到目标 Droplet。
第 2 步:下载目标配置脚本使用以下命令:
wget https://solutions-files.ams3.digitaloceanspaces.com/MySQL-MariaDB-Monitoring/DO_MySQL_MariaDB_Target_Config.sh
第 3 步:下载脚本后,确保它已包含可执行权限由running:
chmod x DO_MySQL_MariaDB_Target_Config.sh
第 4 步:执行脚本running:
./DO_MySQL_MariaDB_Target_Config.sh
第 5 步:输入 mysql_exporter 用户的新密码,然后输入MySQL 根目录密码:
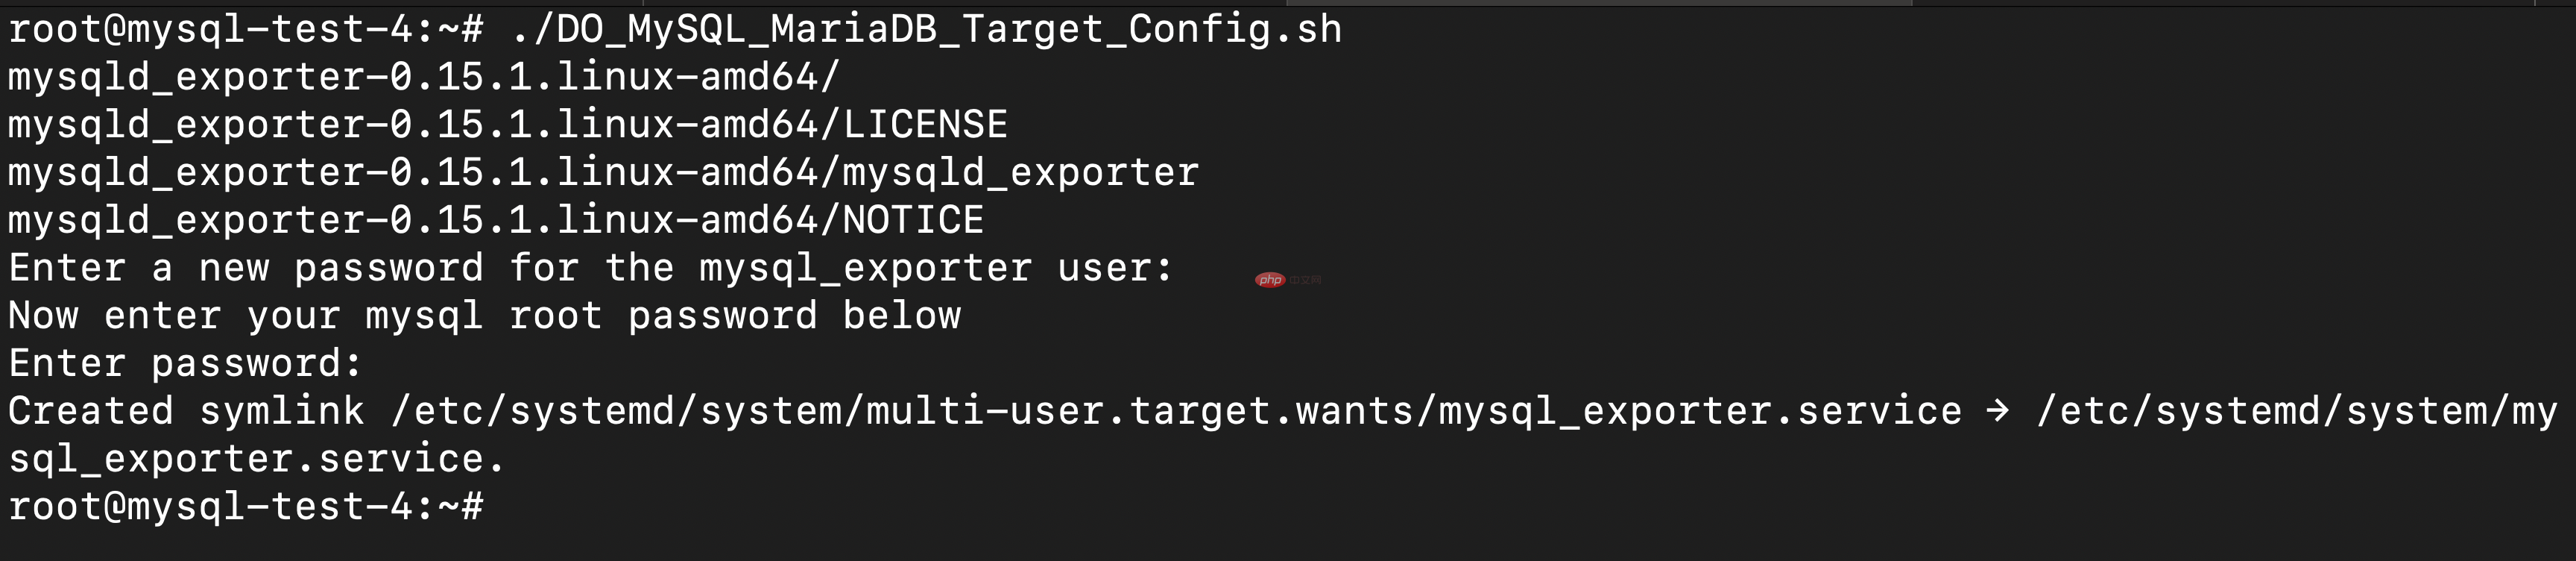
配置完成。
配置 Prometheus Droplet(脚本方法)
第 1 步:通过 SSH 登录 Prometheus Droplet .
第 2 步:使用以下命令下载 Prometheus 配置脚本命令:
wget https://solutions-files.ams3.digitaloceanspaces.com/MySQL-MariaDB-Monitoring/DO_MySQL_MariaDB_Prometheus_Config.sh
这个 bash脚本自动更新Prometheus配置文件添加 新的服务器端点。首先备份当前的 带有时间戳文件名的 prometheus.yml 文件。
然后脚本提示用户指定要添加的服务器数量并验证此输入。
对于每个服务器,它请求一个主机名和IP 地址,确保 每个 IP 地址在配置文件中都是唯一的。有效服务器 配置附加到 prometheus.yml 文件中。更新后 配置完成后,脚本会重启 Prometheus 服务并检查 其状态以确认更改已应用。
最后,它在退出之前等待用户输入。
第 3 步:下载脚本后,通过以下方式确保其具有可执行权限running:
chmod x DO_MySQL_MariaDB_Prometheus_Config.sh
第 4 步:执行脚本running:
./DO_MySQL_MariaDB_Prometheus_Config.sh
第 5 步:输入要添加到监控的 Droplet 数量。
第6步:输入主机名和IP地址。
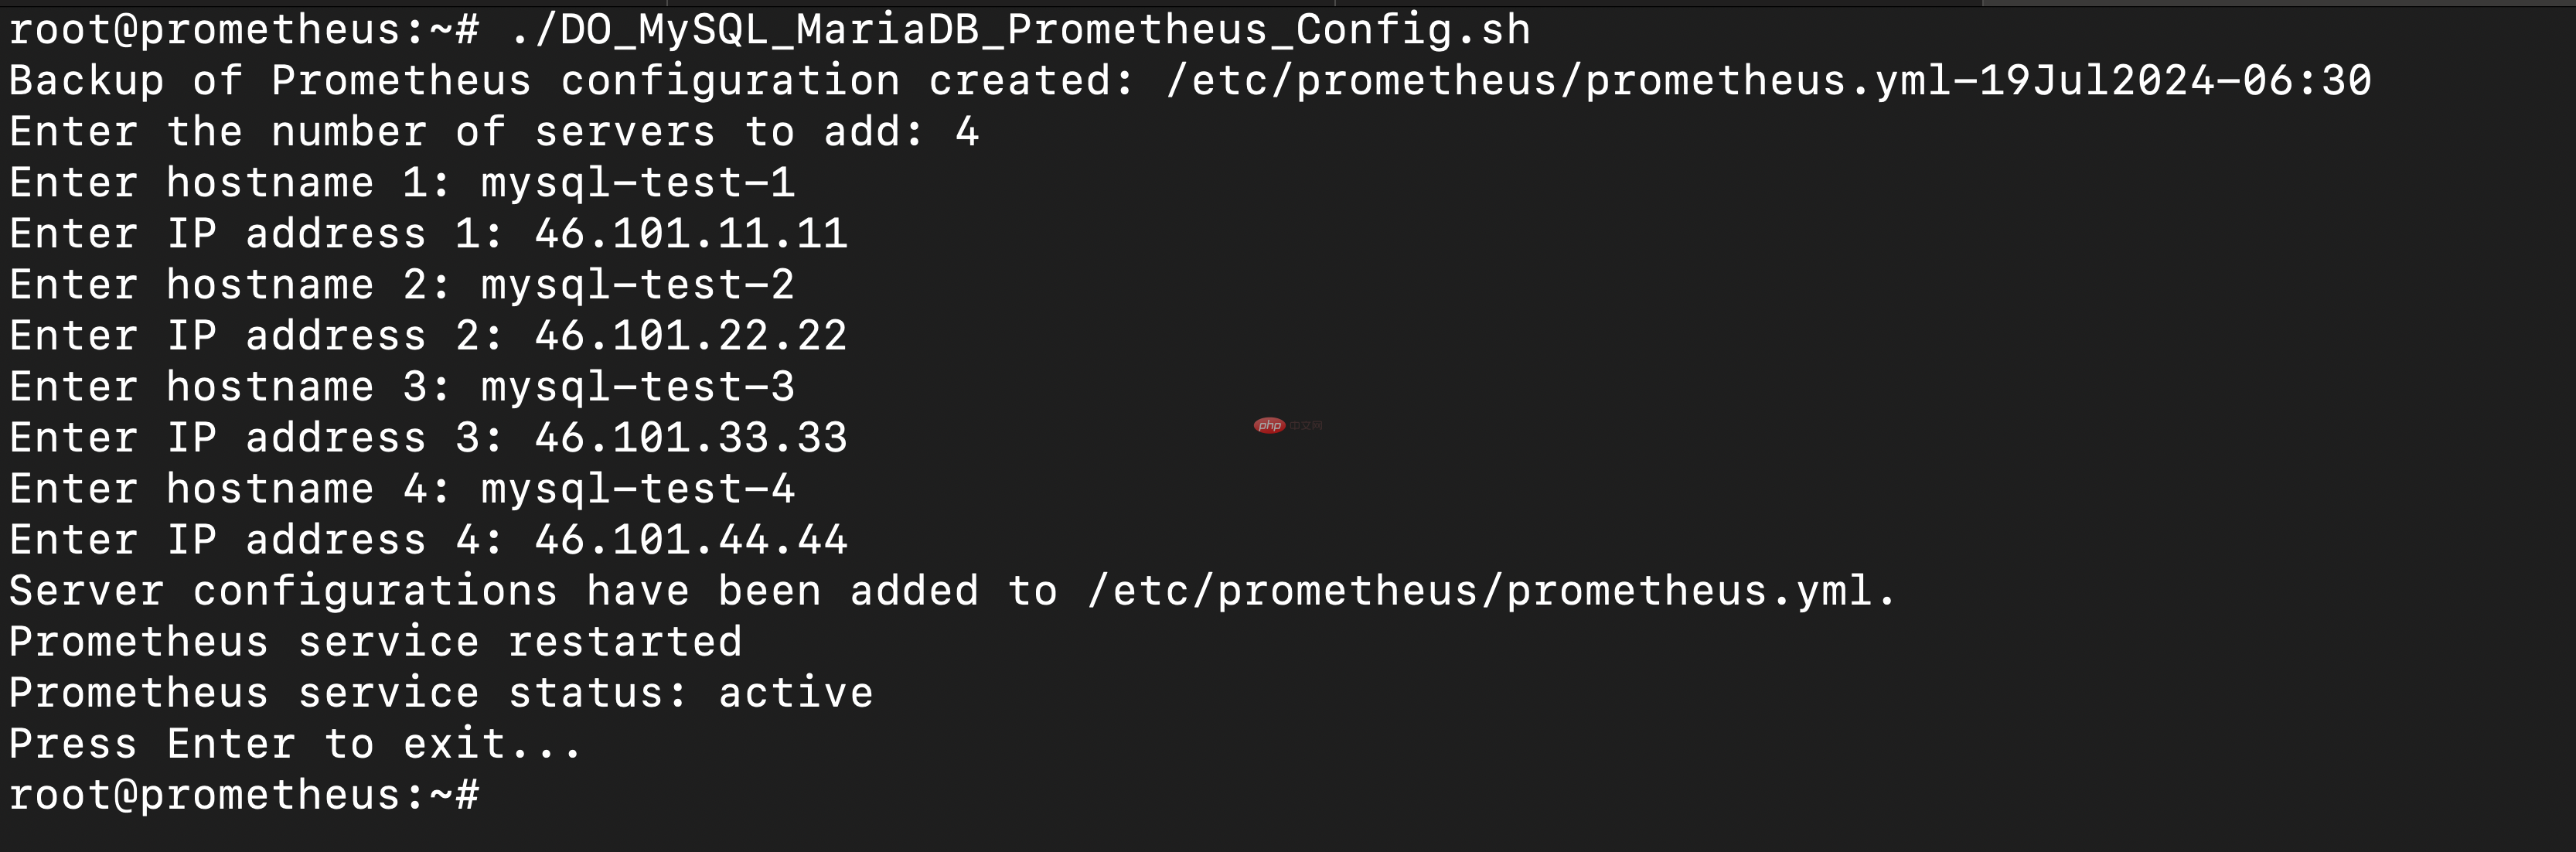
第 7 步:配置完成。
第 8 步:添加后,通过访问 URLprometheushostname:9090/ 检查目标是否已更新目标。
配置 Grafana
步骤1:在浏览器上访问 Grafana-IP:3000 登录 Grafana 仪表板。
步骤 2:转到配置 > 数据源。
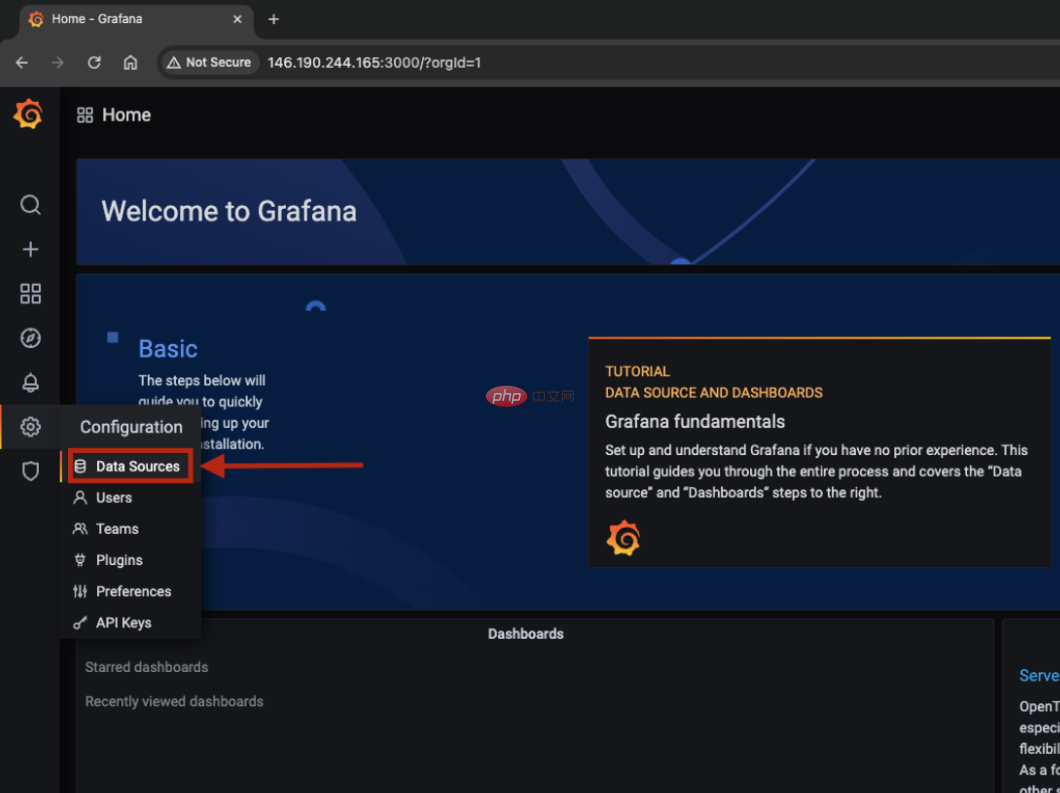
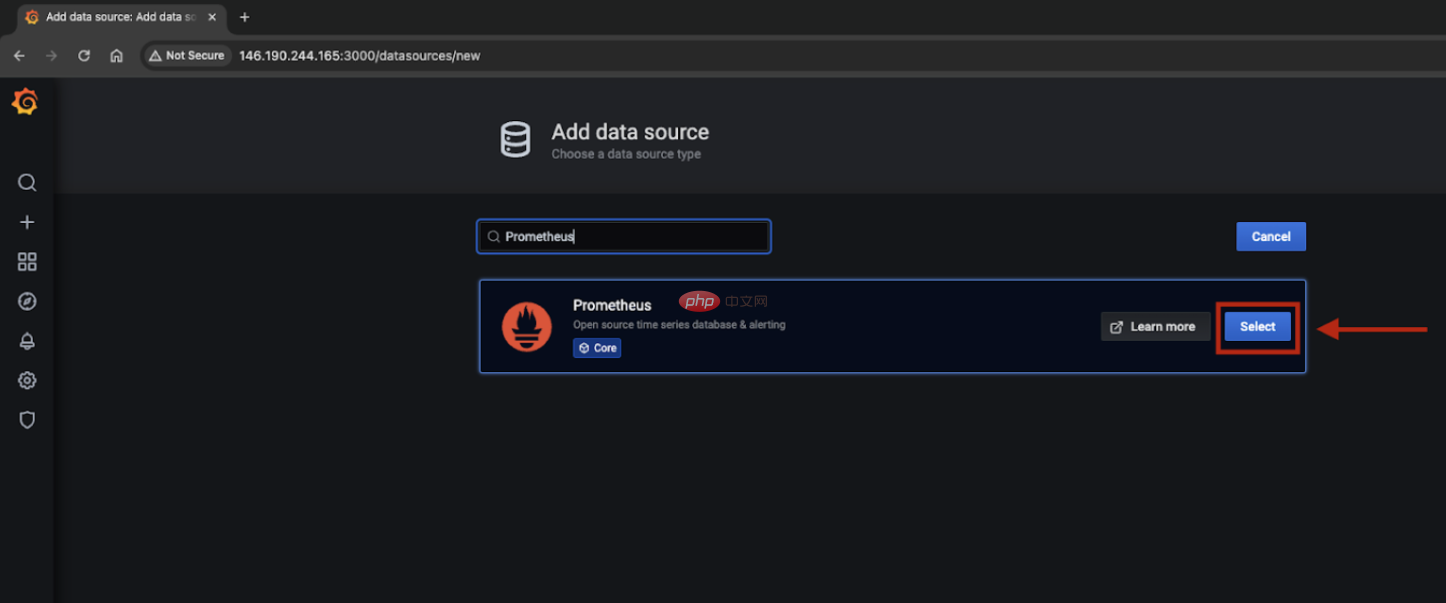
步骤3:点击添加数据源。
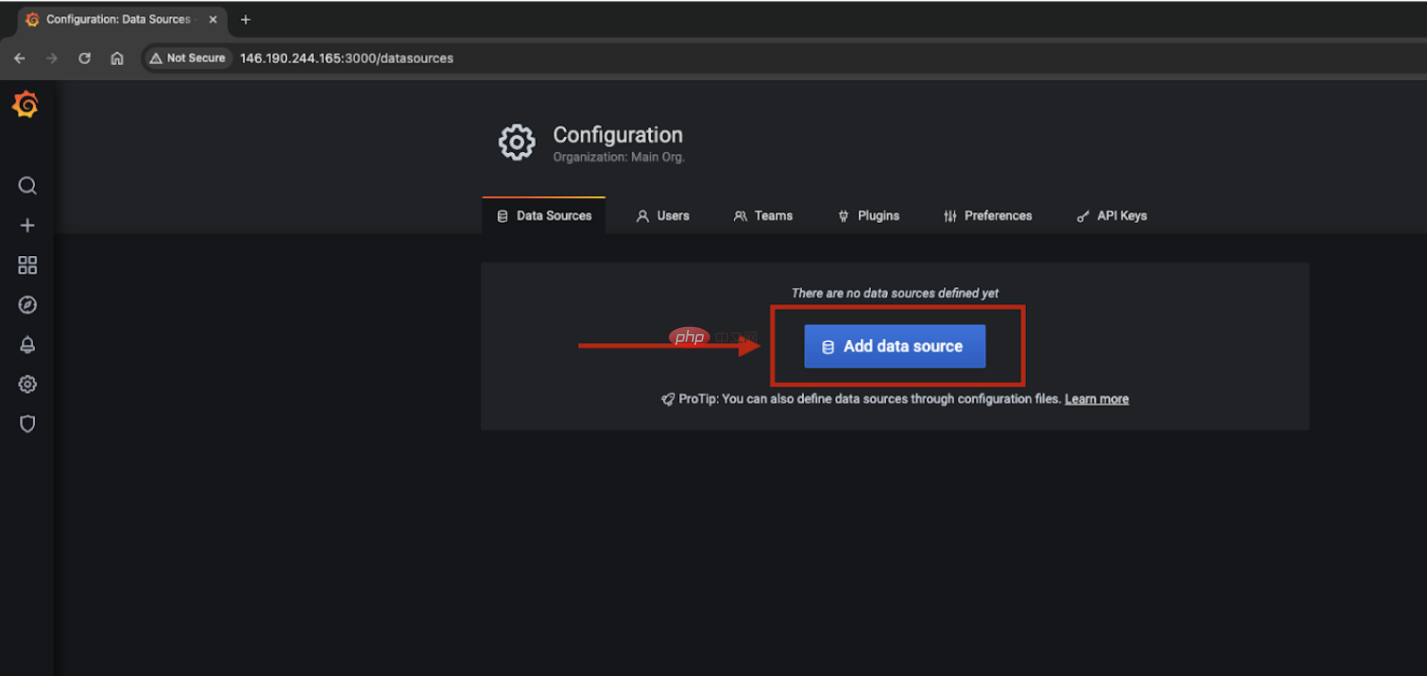
第 4 步:搜索并选择 Prometheus。
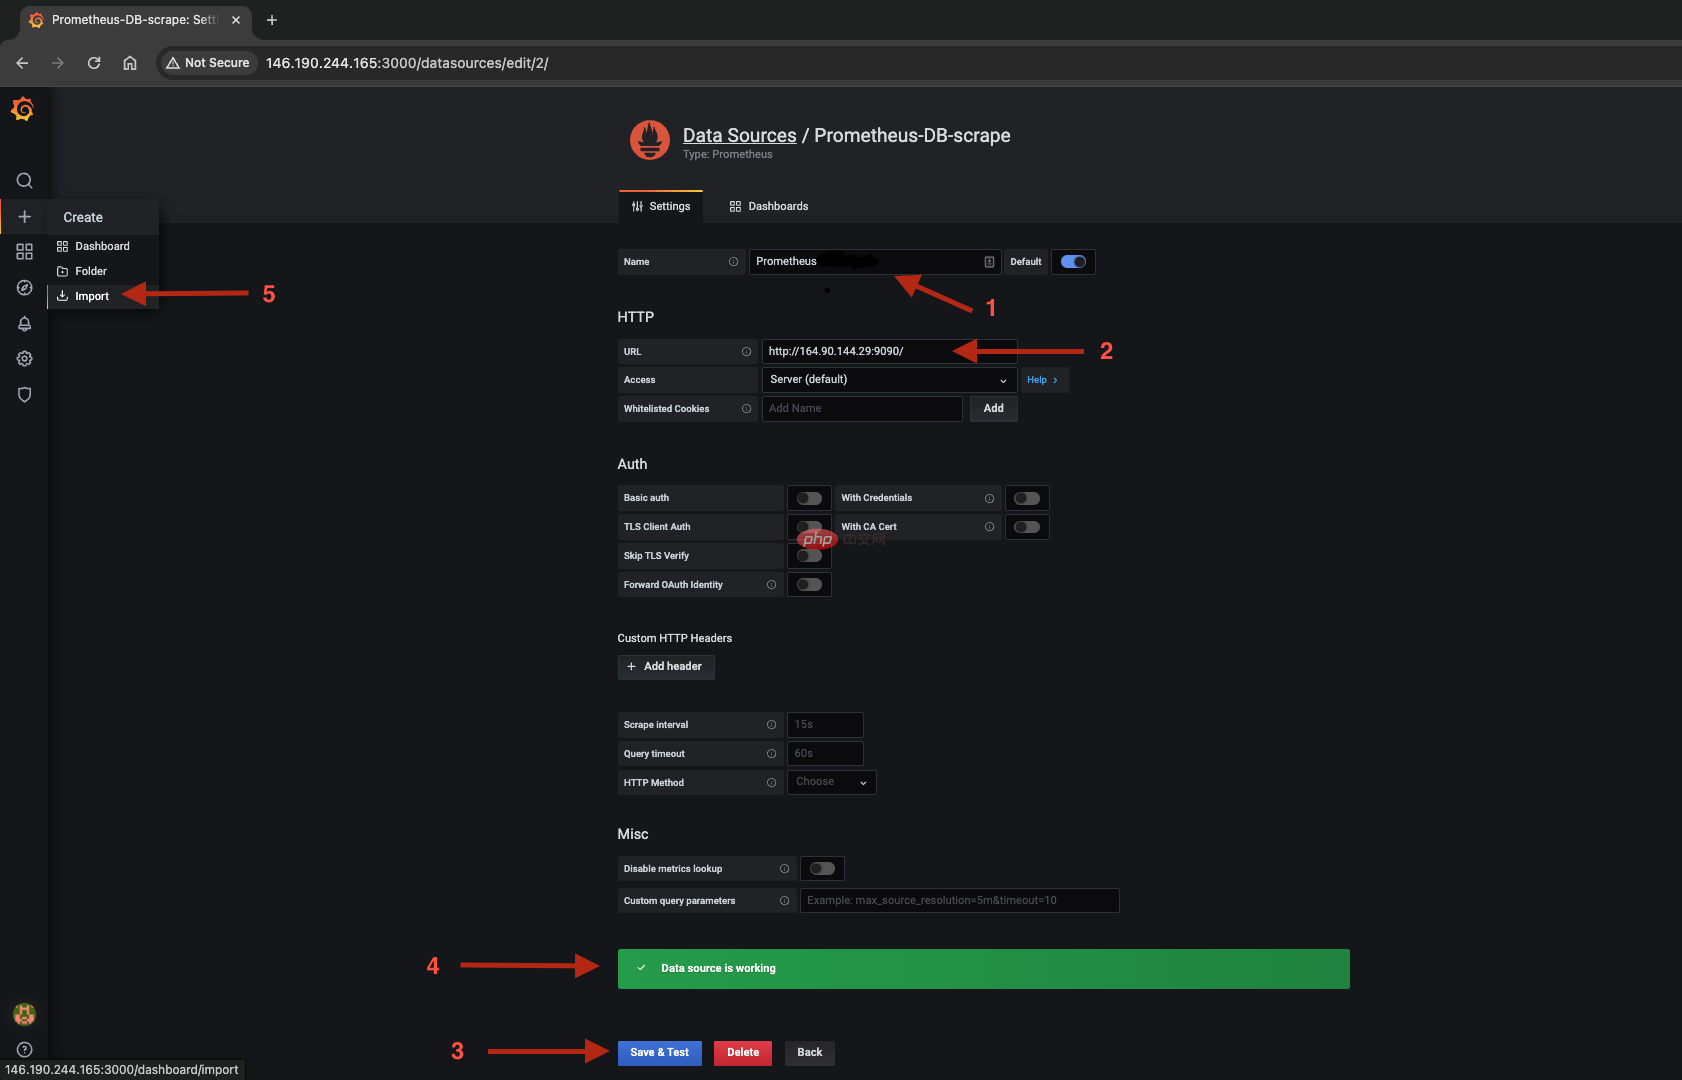
第 5 步:输入 Prometheus 名称和 URL (Prometheus主机名:9090)并单击“保存并测试”。如果看到“数据源正在运行”,则说明您已成功添加数据源。完成后,转到“创建”>“导入”。
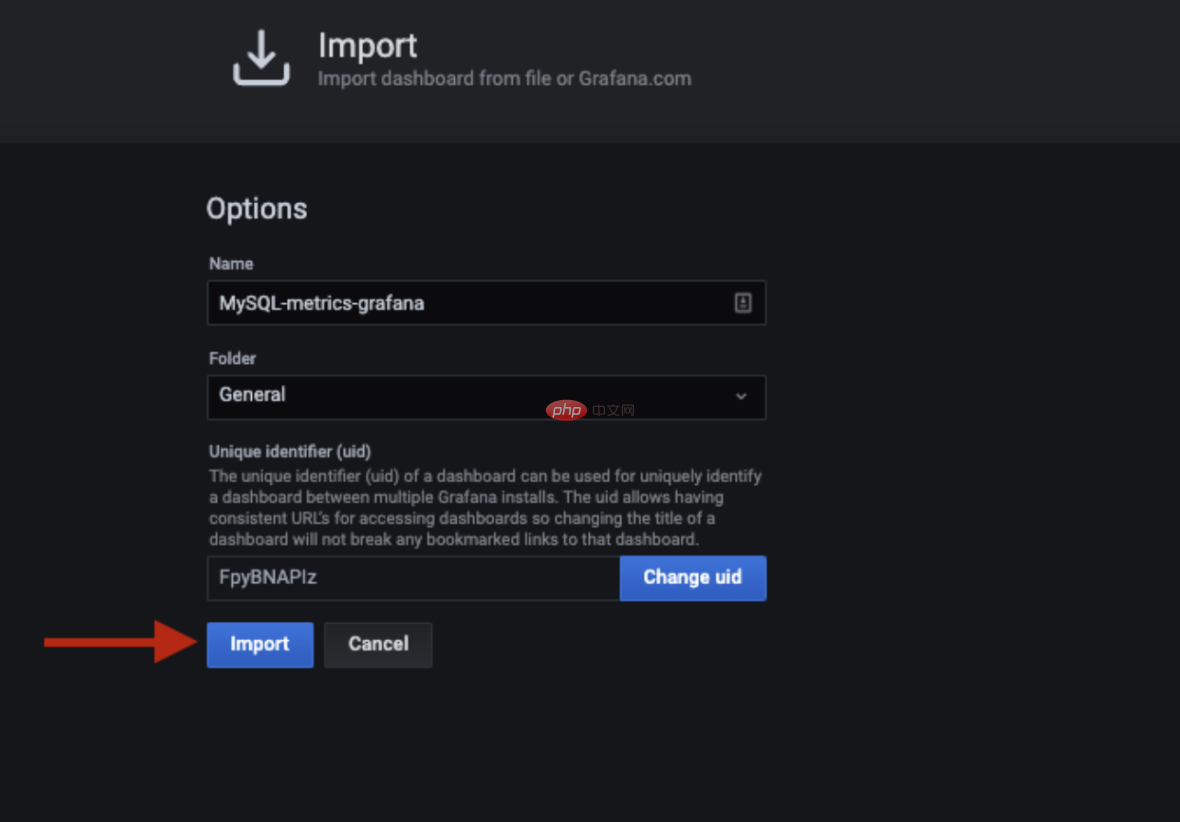
第 6 步:您可以手动配置仪表板或 通过上传 JSON 文件导入仪表板。 JSON 模板 MySQL和MariaDB监控可以在以下链接找到:
https://solutions-files.ams3.digitaloceanspaces.com/MySQL-MariaDB-Monitoring/DO_Grafana-Mysql-MariaDB_Monitoring.json
第7步:填写田野和导入。
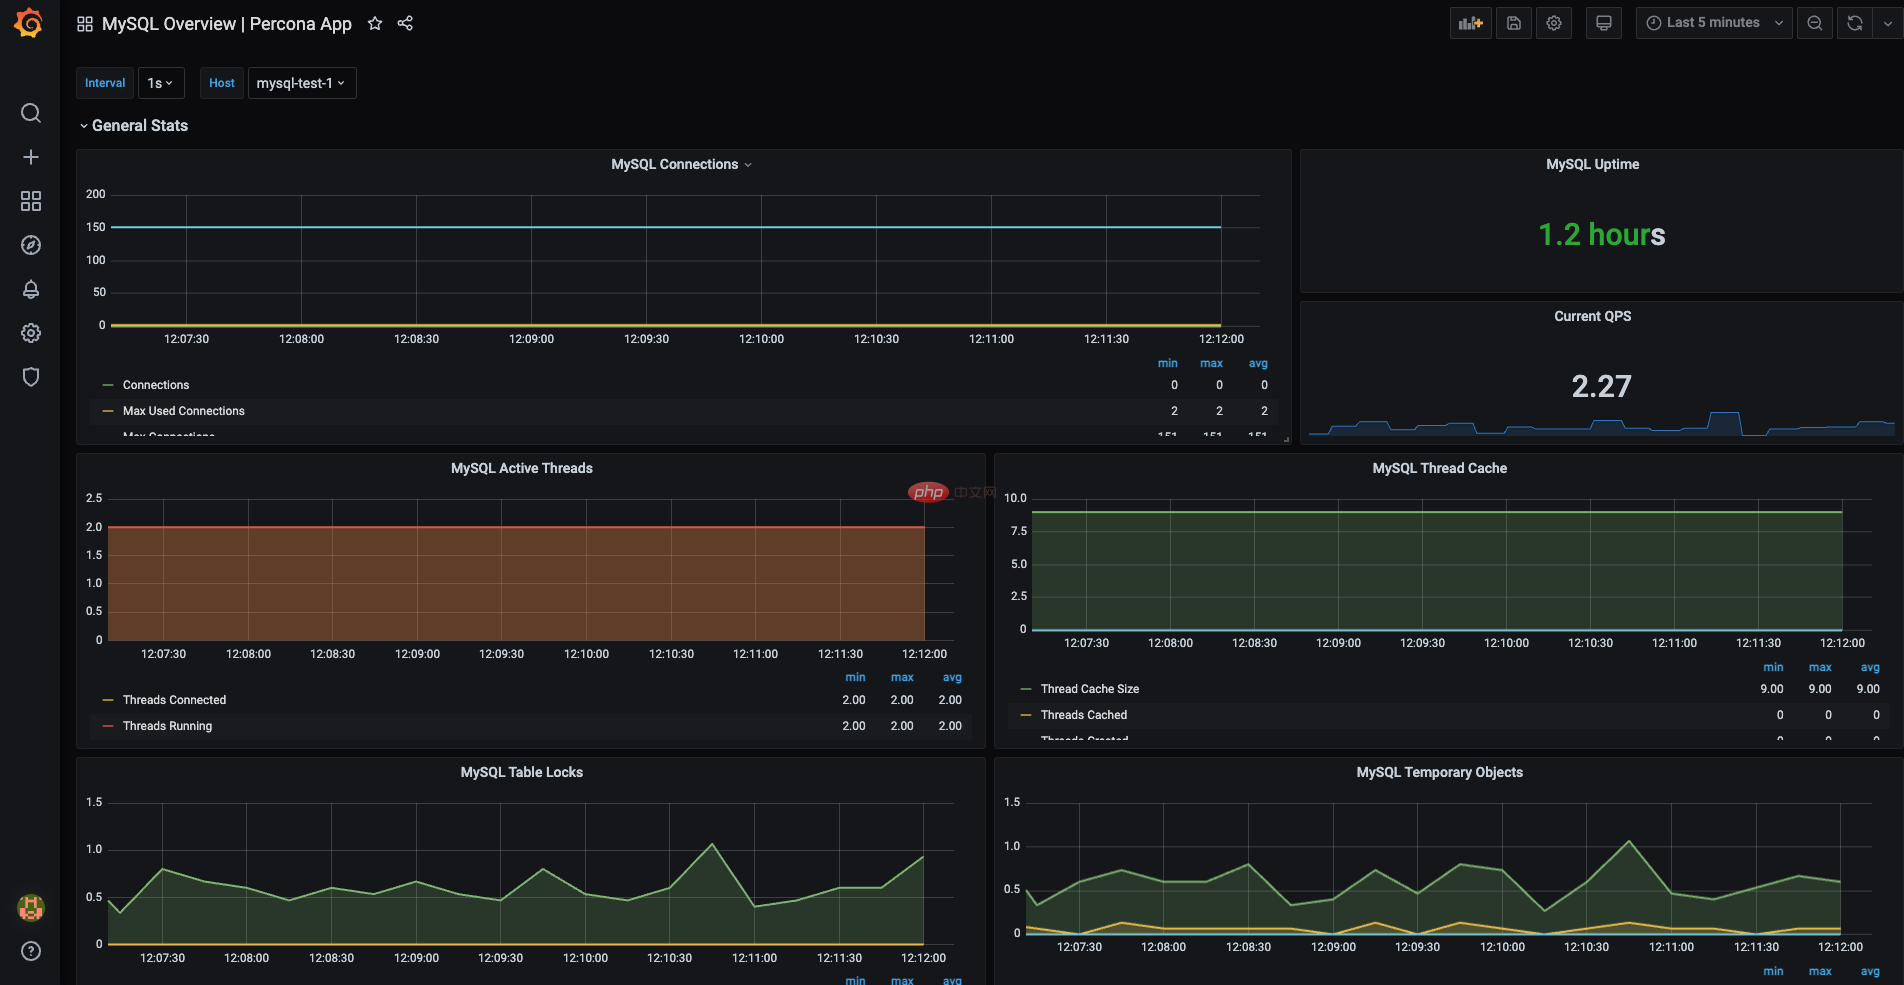
第 8 步:Grafana 仪表板已准备就绪。选择 托管并检查指标是否可见。您可以修改和编辑 根据需要使用仪表板。
The above is the detailed content of Monitor MySQL and MariaDB Droplets with Prometheus MySQL Exporter. For more information, please follow other related articles on the PHP Chinese website!

Hot AI Tools

Undresser.AI Undress
AI-powered app for creating realistic nude photos

AI Clothes Remover
Online AI tool for removing clothes from photos.

Undress AI Tool
Undress images for free

Clothoff.io
AI clothes remover

AI Hentai Generator
Generate AI Hentai for free.

Hot Article
Hot Tools

Notepad++7.3.1
Easy-to-use and free code editor

SublimeText3 Chinese version
Chinese version, very easy to use

Zend Studio 13.0.1
Powerful PHP integrated development environment

Dreamweaver CS6
Visual web development tools

SublimeText3 Mac version
God-level code editing software (SublimeText3)
Hot Topics
 1377
1377
 52
52

 MySQL's Place: Databases and Programming
Apr 13, 2025 am 12:18 AM
MySQL's Place: Databases and Programming
Apr 13, 2025 am 12:18 AM
MySQL's position in databases and programming is very important. It is an open source relational database management system that is widely used in various application scenarios. 1) MySQL provides efficient data storage, organization and retrieval functions, supporting Web, mobile and enterprise-level systems. 2) It uses a client-server architecture, supports multiple storage engines and index optimization. 3) Basic usages include creating tables and inserting data, and advanced usages involve multi-table JOINs and complex queries. 4) Frequently asked questions such as SQL syntax errors and performance issues can be debugged through the EXPLAIN command and slow query log. 5) Performance optimization methods include rational use of indexes, optimized query and use of caches. Best practices include using transactions and PreparedStatemen
 How Tomcat logs help troubleshoot memory leaks
Apr 12, 2025 pm 11:42 PM
How Tomcat logs help troubleshoot memory leaks
Apr 12, 2025 pm 11:42 PM
Tomcat logs are the key to diagnosing memory leak problems. By analyzing Tomcat logs, you can gain insight into memory usage and garbage collection (GC) behavior, effectively locate and resolve memory leaks. Here is how to troubleshoot memory leaks using Tomcat logs: 1. GC log analysis First, enable detailed GC logging. Add the following JVM options to the Tomcat startup parameters: -XX: PrintGCDetails-XX: PrintGCDateStamps-Xloggc:gc.log These parameters will generate a detailed GC log (gc.log), including information such as GC type, recycling object size and time. Analysis gc.log
 How to start apache
Apr 13, 2025 pm 01:06 PM
How to start apache
Apr 13, 2025 pm 01:06 PM
The steps to start Apache are as follows: Install Apache (command: sudo apt-get install apache2 or download it from the official website) Start Apache (Linux: sudo systemctl start apache2; Windows: Right-click the "Apache2.4" service and select "Start") Check whether it has been started (Linux: sudo systemctl status apache2; Windows: Check the status of the "Apache2.4" service in the service manager) Enable boot automatically (optional, Linux: sudo systemctl
 What to do if the apache80 port is occupied
Apr 13, 2025 pm 01:24 PM
What to do if the apache80 port is occupied
Apr 13, 2025 pm 01:24 PM
When the Apache 80 port is occupied, the solution is as follows: find out the process that occupies the port and close it. Check the firewall settings to make sure Apache is not blocked. If the above method does not work, please reconfigure Apache to use a different port. Restart the Apache service.
 How to configure Debian Apache log format
Apr 12, 2025 pm 11:30 PM
How to configure Debian Apache log format
Apr 12, 2025 pm 11:30 PM
This article describes how to customize Apache's log format on Debian systems. The following steps will guide you through the configuration process: Step 1: Access the Apache configuration file The main Apache configuration file of the Debian system is usually located in /etc/apache2/apache2.conf or /etc/apache2/httpd.conf. Open the configuration file with root permissions using the following command: sudonano/etc/apache2/apache2.conf or sudonano/etc/apache2/httpd.conf Step 2: Define custom log formats to find or
 How to connect to the database of apache
Apr 13, 2025 pm 01:03 PM
How to connect to the database of apache
Apr 13, 2025 pm 01:03 PM
Apache connects to a database requires the following steps: Install the database driver. Configure the web.xml file to create a connection pool. Create a JDBC data source and specify the connection settings. Use the JDBC API to access the database from Java code, including getting connections, creating statements, binding parameters, executing queries or updates, and processing results.
 How to monitor Nginx SSL performance on Debian
Apr 12, 2025 pm 10:18 PM
How to monitor Nginx SSL performance on Debian
Apr 12, 2025 pm 10:18 PM
This article describes how to effectively monitor the SSL performance of Nginx servers on Debian systems. We will use NginxExporter to export Nginx status data to Prometheus and then visually display it through Grafana. Step 1: Configuring Nginx First, we need to enable the stub_status module in the Nginx configuration file to obtain the status information of Nginx. Add the following snippet in your Nginx configuration file (usually located in /etc/nginx/nginx.conf or its include file): location/nginx_status{stub_status
 How to set up a recycling bin in Debian system
Apr 12, 2025 pm 10:51 PM
How to set up a recycling bin in Debian system
Apr 12, 2025 pm 10:51 PM
This article introduces two methods of configuring a recycling bin in a Debian system: a graphical interface and a command line. Method 1: Use the Nautilus graphical interface to open the file manager: Find and start the Nautilus file manager (usually called "File") in the desktop or application menu. Find the Recycle Bin: Look for the Recycle Bin folder in the left navigation bar. If it is not found, try clicking "Other Location" or "Computer" to search. Configure Recycle Bin properties: Right-click "Recycle Bin" and select "Properties". In the Properties window, you can adjust the following settings: Maximum Size: Limit the disk space available in the Recycle Bin. Retention time: Set the preservation before the file is automatically deleted in the recycling bin
