

Calculating Mean, Median and Mode in Excel

Unlocking the Power of Excel: Mastering Mean, Median, and Mode
When analyzing numerical data, identifying the "typical" value is crucial. Measures of central tendency—mean, median, and mode—provide single values representing the central position within a dataset. These are also considered summary statistics. While all three are valid, they offer different perspectives on the typical value, making some more suitable than others depending on the context.
This guide explores calculating mean, median, and mode in Microsoft Excel, highlighting their strengths and weaknesses.
Calculating the Mean (Average) in Excel
The arithmetic mean, or average, is the sum of numbers divided by their count. For example, the mean of {1, 2, 2, 3, 4, 6} is (1 2 2 3 4 6)/6 = 3.
Excel offers several functions for calculating the mean:
-
AVERAGE: Calculates the average of numbers. -
AVERAGEA: Calculates the average of cells containing any data (numbers, Boolean values, text). -
AVERAGEIF: Calculates the average of numbers based on a single criterion. -
AVERAGEIFS: Calculates the average based on multiple criteria.
Let's illustrate with a sales report (see image below). To find the average of values in cells C2:C8, use: =AVERAGE(C2:C8)
To average only "Banana" sales: =AVERAGEIF(A2:A8, "Banana", C2:C8)
To average "Banana" sales that are "Delivered": =AVERAGEIFS(C2:C8, A2:A8, "Banana", B2:B8, "Delivered")
You can also reference conditions from separate cells.

Calculating the Median in Excel
The median is the middle value in an ordered dataset. Half the values are above, and half are below it. For {1, 2, 2, 3, 4, 6, 9}, the median is 3. With an even number of values, the median is the average of the two middle values. For {1, 2, 2, 3, 4, 6}, the median is (2 3)/2 = 2.5.
Excel uses the MEDIAN function. To find the median of amounts in our sales report: =MEDIAN(C2:C8)
The image below shows the data sorted (though not required for the function).

While Excel lacks direct MEDIANIF and MEDIANIFS functions, you can achieve conditional medians using combinations of functions (see examples linked in the original article).


Calculating the Mode in Excel
The mode is the most frequent value. For {1, 2, 2, 3, 4, 6}, the mode is 2. Excel's MODE function returns the lowest mode if multiple modes exist. For our data: =MODE(C2:C8)

Mean vs. Median: Which is Better?
The best measure depends on the data and your definition of "typical." In symmetrical distributions, mean, median, and mode are equal. In skewed distributions, they differ. The mean is highly sensitive to outliers, while the median is more robust. Therefore, the median is often preferred for asymmetrical distributions, such as typical salaries. An example demonstrates how a single high salary drastically inflates the mean but minimally affects the median, making the median a more representative measure of typical earnings.

This guide provides a comprehensive overview of calculating mean, median, and mode in Excel. Remember to choose the most appropriate measure based on your data's characteristics.
The above is the detailed content of Calculating Mean, Median and Mode in Excel. For more information, please follow other related articles on the PHP Chinese website!

Hot AI Tools

Undresser.AI Undress
AI-powered app for creating realistic nude photos

AI Clothes Remover
Online AI tool for removing clothes from photos.

Undress AI Tool
Undress images for free

Clothoff.io
AI clothes remover

Video Face Swap
Swap faces in any video effortlessly with our completely free AI face swap tool!

Hot Article
Hot Tools

Notepad++7.3.1
Easy-to-use and free code editor

SublimeText3 Chinese version
Chinese version, very easy to use

Zend Studio 13.0.1
Powerful PHP integrated development environment

Dreamweaver CS6
Visual web development tools

SublimeText3 Mac version
God-level code editing software (SublimeText3)
Hot Topics
 1392
1392
 52
36
110
52
36
110

 Excel formula to find top 3, 5, 10 values in column or row
Apr 01, 2025 am 05:09 AM
Excel formula to find top 3, 5, 10 values in column or row
Apr 01, 2025 am 05:09 AM
This tutorial demonstrates how to efficiently locate the top N values within a dataset and retrieve associated data using Excel formulas. Whether you need the highest, lowest, or those meeting specific criteria, this guide provides solutions. Findi
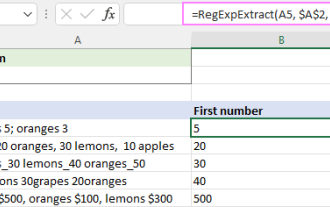 Regex to extract strings in Excel (one or all matches)
Mar 28, 2025 pm 12:19 PM
Regex to extract strings in Excel (one or all matches)
Mar 28, 2025 pm 12:19 PM
In this tutorial, you'll learn how to use regular expressions in Excel to find and extract substrings matching a given pattern. Microsoft Excel provides a number of functions to extract text from cells. Those functions can cope with most
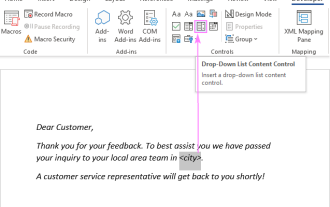 Add a dropdown list to Outlook email template
Apr 01, 2025 am 05:13 AM
Add a dropdown list to Outlook email template
Apr 01, 2025 am 05:13 AM
This tutorial shows you how to add dropdown lists to your Outlook email templates, including multiple selections and database population. While Outlook doesn't directly support dropdowns, this guide provides creative workarounds. Email templates sav
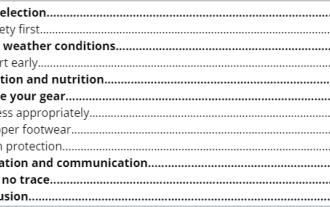 How to customize Google Docs: guide on styles & formatting
Mar 24, 2025 am 10:24 AM
How to customize Google Docs: guide on styles & formatting
Mar 24, 2025 am 10:24 AM
In this blog post, we delve into the various techniques and features available to customize your Google Docs. Follow these tips and tricks to be well on your way to creating documents that convey your content effectively and look polished
 How to use Flash Fill in Excel with examples
Apr 05, 2025 am 09:15 AM
How to use Flash Fill in Excel with examples
Apr 05, 2025 am 09:15 AM
This tutorial provides a comprehensive guide to Excel's Flash Fill feature, a powerful tool for automating data entry tasks. It covers various aspects, from its definition and location to advanced usage and troubleshooting. Understanding Excel's Fla
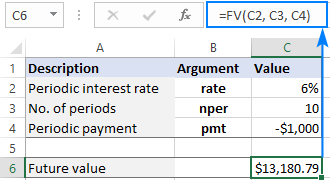 FV function in Excel to calculate future value
Apr 01, 2025 am 04:57 AM
FV function in Excel to calculate future value
Apr 01, 2025 am 04:57 AM
This tutorial explains how to use Excel's FV function to determine the future value of investments, encompassing both regular payments and lump-sum deposits. Effective financial planning hinges on understanding investment growth, and this guide prov
 How to add calendar to Outlook: shared, Internet calendar, iCal file
Apr 03, 2025 am 09:06 AM
How to add calendar to Outlook: shared, Internet calendar, iCal file
Apr 03, 2025 am 09:06 AM
This article explains how to access and utilize shared calendars within the Outlook desktop application, including importing iCalendar files. Previously, we covered sharing your Outlook calendar. Now, let's explore how to view calendars shared with
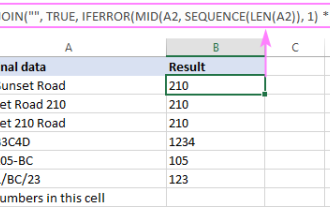 How to remove / split text and numbers in Excel cell
Apr 01, 2025 am 05:07 AM
How to remove / split text and numbers in Excel cell
Apr 01, 2025 am 05:07 AM
This tutorial demonstrates several methods for separating text and numbers within Excel cells, utilizing both built-in functions and custom VBA functions. You'll learn how to extract numbers while removing text, isolate text while discarding numbers
