

Standard deviation Excel: functions and formula examples

This tutorial clarifies the distinction between standard deviation and standard error of the mean, guiding you on the optimal Excel functions for standard deviation calculations.
In descriptive statistics, the mean and standard deviation are intrinsically linked. While the mean is widely understood, the standard deviation often remains less clear. This tutorial aims to demystify standard deviation and demonstrate its Excel calculation.
Key Concepts:
-
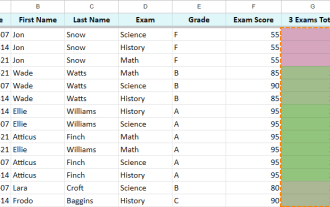
Standard Deviation: A measure quantifying data dispersion around the mean. A low standard deviation indicates data clustered near the mean, while a high standard deviation signifies greater variability. This helps determine the mean's representativeness of the data. A standard deviation of zero implies all data points are identical to the mean.
-
Sample vs. Population Standard Deviation: The calculation differs based on whether the data represents the entire population or a sample. Sample standard deviation uses Bessel's correction (dividing by n-1 instead of n) to account for bias in estimating the population mean from a sample.
-
Standard Deviation Formula:
Sample Standard Deviation Population Standard Deviation 
Where: xi represents individual data points, x̄ is the mean, and n is the data count.
-
Step-by-Step Calculation:
-
Calculate the Mean: Sum the data points and divide by their count. Excel's
AVERAGEfunction simplifies this. - Calculate Deviations and Square: Subtract the mean from each data point and square the result.
- Sum Squared Deviations: Add the squared deviations.
- Divide by n or n-1: Divide by n for population standard deviation, n-1 for sample standard deviation.
- Take the Square Root: The result is the standard deviation.
-
Calculate the Mean: Sum the data points and divide by their count. Excel's
-
Excel Functions:
Function Description Sample/Population Includes Text/Logical? Excel Version STDEVOlder sample standard deviation function Sample No 2003-2019 STDEV.SImproved sample standard deviation function Sample No 2010-2019 STDEVASample standard deviation, includes text/logical Sample Yes 2003-2019 STDEVPOlder population standard deviation function Population No 2003-2019 STDEV.PImproved population standard deviation function Population No 2010-2019 STDEVPAPopulation standard deviation, includes text/logical Population Yes 2003-2019 -
Adding Standard Deviation Error Bars to Charts: Select the chart, click "Chart Elements," choose "Error Bars," and select "Standard Deviation."
-
Standard Deviation vs. Standard Error of the Mean (SEM): Standard deviation measures data variability; SEM estimates how much a sample mean differs from the true population mean. SEM = Standard Deviation / √(Sample Size). Excel formula:
=STDEV.S(range)/SQRT(COUNT(range))


This enhanced explanation provides a more comprehensive understanding of standard deviation and its practical application within Excel. Remember to select the appropriate Excel function based on your data type (sample or population) and whether non-numeric values are present.
The above is the detailed content of Standard deviation Excel: functions and formula examples. For more information, please follow other related articles on the PHP Chinese website!

Hot AI Tools

Undresser.AI Undress
AI-powered app for creating realistic nude photos

AI Clothes Remover
Online AI tool for removing clothes from photos.

Undress AI Tool
Undress images for free

Clothoff.io
AI clothes remover

AI Hentai Generator
Generate AI Hentai for free.

Hot Article
Hot Tools

Notepad++7.3.1
Easy-to-use and free code editor

SublimeText3 Chinese version
Chinese version, very easy to use

Zend Studio 13.0.1
Powerful PHP integrated development environment

Dreamweaver CS6
Visual web development tools

SublimeText3 Mac version
God-level code editing software (SublimeText3)
Hot Topics
 1377
1377
 52
52

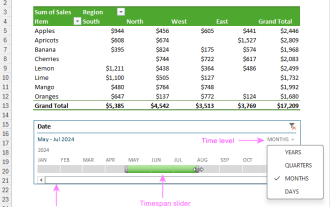 How to create timeline in Excel to filter pivot tables and charts
Mar 22, 2025 am 11:20 AM
How to create timeline in Excel to filter pivot tables and charts
Mar 22, 2025 am 11:20 AM
This article will guide you through the process of creating a timeline for Excel pivot tables and charts and demonstrate how you can use it to interact with your data in a dynamic and engaging way. You've got your data organized in a pivo
 how to sum a column in excel
Mar 14, 2025 pm 02:42 PM
how to sum a column in excel
Mar 14, 2025 pm 02:42 PM
The article discusses methods to sum columns in Excel using the SUM function, AutoSum feature, and how to sum specific cells.
 how to make pie chart in excel
Mar 14, 2025 pm 03:32 PM
how to make pie chart in excel
Mar 14, 2025 pm 03:32 PM
The article details steps to create and customize pie charts in Excel, focusing on data preparation, chart insertion, and personalization options for enhanced visual analysis.
 how to make a table in excel
Mar 14, 2025 pm 02:53 PM
how to make a table in excel
Mar 14, 2025 pm 02:53 PM
Article discusses creating, formatting, and customizing tables in Excel, and using functions like SUM, AVERAGE, and PivotTables for data analysis.
 Excel formula to find top 3, 5, 10 values in column or row
Apr 01, 2025 am 05:09 AM
Excel formula to find top 3, 5, 10 values in column or row
Apr 01, 2025 am 05:09 AM
This tutorial demonstrates how to efficiently locate the top N values within a dataset and retrieve associated data using Excel formulas. Whether you need the highest, lowest, or those meeting specific criteria, this guide provides solutions. Findi
 how to calculate mean in excel
Mar 14, 2025 pm 03:33 PM
how to calculate mean in excel
Mar 14, 2025 pm 03:33 PM
Article discusses calculating mean in Excel using AVERAGE function. Main issue is how to efficiently use this function for different data sets.(158 characters)
 All you need to know to sort any data in Google Sheets
Mar 22, 2025 am 10:47 AM
All you need to know to sort any data in Google Sheets
Mar 22, 2025 am 10:47 AM
Mastering Google Sheets Sorting: A Comprehensive Guide Sorting data in Google Sheets needn't be complex. This guide covers various techniques, from sorting entire sheets to specific ranges, by color, date, and multiple columns. Whether you're a novi
 how to add drop down in excel
Mar 14, 2025 pm 02:51 PM
how to add drop down in excel
Mar 14, 2025 pm 02:51 PM
Article discusses creating, editing, and removing drop-down lists in Excel using data validation. Main issue: how to manage drop-down lists effectively.
