

What is SPC Charts? - Analytics Vidhya

Introduction
Statistical Process Control (SPC) charts are essential tools in quality management, enabling organizations to monitor, control, and improve their processes. By applying statistical methods, SPC charts visually represent data variations and patterns, ensuring consistent product quality. This guide explores various SPC chart types, their functionalities, and practical applications.

Key Takeaways
This guide will cover: the fundamentals of SPC charts; different SPC chart types; the advantages of using SPC charts in quality management; effective implementation strategies; and creating SPC charts using Python and Excel.
Table of contents
- What are SPC Charts?
- Types of SPC Charts
- Advantages of Using SPC Charts
- Effective Implementation of SPC Charts
- Python Example: Creating an SPC Chart
- Excel Example: Creating an SPC Chart
- Frequently Asked Questions
What are SPC Charts?
SPC charts, also known as control charts, graphically display data points over time. They differentiate between common-cause variation (inherent to the process) and special-cause variation (unusual or assignable causes). This distinction is crucial for maintaining process stability and identifying areas for improvement.
Types of SPC Charts
Several SPC chart types cater to different data and process characteristics. Key types include:
- X-bar and R Chart: Monitors the process mean (X-bar) and range (R) within subgroups. The X-bar chart tracks average subgroup values, while the R chart tracks the range within each subgroup.
- P-Chart: Tracks the proportion of defective items within a sample. Suitable for categorical data where each item is either defective or non-defective.
- C-Chart: Counts the number of defects in a single unit of product. Ideal for processes where the number of defects per unit is counted.
- U-Chart: Similar to the C-chart, but accounts for varying sample sizes. Monitors defects per unit, offering greater sample size flexibility.
Advantages of Using SPC Charts
Implementing SPC charts offers numerous benefits:
- Enhanced Quality Control: Provides ongoing process monitoring and control, ensuring consistent product quality.
- Early Problem Detection: Enables timely identification of process deviations, facilitating prompt corrective actions.
- Data-Driven Decision Making: Offers a visual representation of process data, supporting informed decisions based on real-time insights.
Effective Implementation of SPC Charts
Successful SPC chart implementation involves these steps:
- Chart Selection: Choose the appropriate chart type based on data and process characteristics.
- Data Collection: Systematically gather accurate and consistent data points.
- Control Limit Calculation: Determine upper and lower control limits based on historical data, defining acceptable variation.
- Data Plotting: Plot data points on the chart, highlighting points outside the control limits.
- Analysis and Action: Analyze the chart for trends or unusual variations. Implement corrective actions for out-of-control points.
Python Example: Creating an SPC Chart
Here's how to create an X-bar and R chart using Python:
import numpy as np
import matplotlib.pyplot as plt

# Sample data
data = np.array([[5, 6, 7], [8, 9, 7], [5, 6, 7], [8, 9, 6], [5, 6, 8]])

# Calculate subgroup means and ranges
x_bar = np.mean(data, axis=1)
R = np.ptp(data, axis=1)

# Calculate overall mean and average range
x_double_bar = np.mean(x_bar)
R_bar = np.mean(R)

# Control limits for X-bar chart
A2 = 0.577  # Factor for X-bar chart control limits
UCL_x_bar = x_double_bar   A2 * R_bar
LCL_x_bar = x_double_bar - A2 * R_bar

# Control limits for R chart
D4 = 2.114  # Factor for R chart upper control limit
D3 = 0    # Factor for R chart lower control limit
UCL_R = D4 * R_bar
LCL_R = D3 * R_bar

# Plot X-bar chart
plt.figure(figsize=(12, 6))
plt.subplot(211)
plt.plot(x_bar, marker='o', linestyle='-', color='b')
plt.axhline(y=x_double_bar, color='g', linestyle='-')
plt.axhline(y=UCL_x_bar, color='r', linestyle='--')
plt.axhline(y=LCL_x_bar, color='r', linestyle='--')
plt.title('X-Bar Chart')
plt.xlabel('Subgroup')
plt.ylabel('Mean')

# Plot R chart
plt.subplot(212)
plt.plot(R, marker='o', linestyle='-', color='b')
plt.axhline(y=R_bar, color='g', linestyle='-')
plt.axhline(y=UCL_R, color='r', linestyle='--')
plt.axhline(y=LCL_R, color='r', linestyle='--')
plt.title('R Chart')
plt.xlabel('Subgroup')
plt.ylabel('Range')
plt.tight_layout()
plt.show()
Code Explanation
This Python script generates X-bar and R charts using sample data, illustrating how these charts track process stability over time. It utilizes NumPy for numerical computations and Matplotlib for visualization.
Excel Example: Creating an SPC Chart
Creating an SPC chart in Excel involves these steps:
- Data Input: Enter your data into an Excel spreadsheet, organizing subgroups in rows and observations in columns.
- Calculations: Use Excel functions (AVERAGE, MAX, MIN) to calculate subgroup averages and ranges.
- Control Limit Determination: Calculate the overall average and average range. Apply appropriate constants (A2, D3, D4) to compute control limits.
- Chart Creation: Select the data and insert a line chart. Add horizontal lines for control limits using Excel's charting features.
Conclusion
Understanding and applying SPC charts is vital for organizations seeking to enhance quality control, improve process efficiency, and achieve superior product quality. SPC charts provide a structured approach to process monitoring and refinement, serving as invaluable tools in quality management.
Frequently Asked Questions
Q1. Applicability of SPC charts in service industries? Yes, SPC charts are applicable in service industries to monitor and improve service quality aspects such as response times, customer satisfaction, and error rates.
Q2. Meaning of control limits? Control limits represent the acceptable range of variation in a process. Data points outside these limits signal potential process issues.
Q3. Role of SPC charts in regulatory compliance? SPC charts help maintain consistent quality, provide evidence of process control, and support documentation requirements for regulatory compliance.
The above is the detailed content of What is SPC Charts? - Analytics Vidhya. For more information, please follow other related articles on the PHP Chinese website!

Hot AI Tools

Undresser.AI Undress
AI-powered app for creating realistic nude photos

AI Clothes Remover
Online AI tool for removing clothes from photos.

Undress AI Tool
Undress images for free

Clothoff.io
AI clothes remover

Video Face Swap
Swap faces in any video effortlessly with our completely free AI face swap tool!

Hot Article
Hot Tools

Notepad++7.3.1
Easy-to-use and free code editor

SublimeText3 Chinese version
Chinese version, very easy to use

Zend Studio 13.0.1
Powerful PHP integrated development environment

Dreamweaver CS6
Visual web development tools

SublimeText3 Mac version
God-level code editing software (SublimeText3)
Hot Topics
 1393
1393
 52
1205
24
52
1205
24

 Best AI Art Generators (Free & Paid) for Creative Projects
Apr 02, 2025 pm 06:10 PM
Best AI Art Generators (Free & Paid) for Creative Projects
Apr 02, 2025 pm 06:10 PM
The article reviews top AI art generators, discussing their features, suitability for creative projects, and value. It highlights Midjourney as the best value for professionals and recommends DALL-E 2 for high-quality, customizable art.
 Is ChatGPT 4 O available?
Mar 28, 2025 pm 05:29 PM
Is ChatGPT 4 O available?
Mar 28, 2025 pm 05:29 PM
ChatGPT 4 is currently available and widely used, demonstrating significant improvements in understanding context and generating coherent responses compared to its predecessors like ChatGPT 3.5. Future developments may include more personalized interactions and real-time data processing capabilities, further enhancing its potential for various applications.
 Getting Started With Meta Llama 3.2 - Analytics Vidhya
Apr 11, 2025 pm 12:04 PM
Getting Started With Meta Llama 3.2 - Analytics Vidhya
Apr 11, 2025 pm 12:04 PM
Meta's Llama 3.2: A Leap Forward in Multimodal and Mobile AI Meta recently unveiled Llama 3.2, a significant advancement in AI featuring powerful vision capabilities and lightweight text models optimized for mobile devices. Building on the success o
 Best AI Chatbots Compared (ChatGPT, Gemini, Claude & More)
Apr 02, 2025 pm 06:09 PM
Best AI Chatbots Compared (ChatGPT, Gemini, Claude & More)
Apr 02, 2025 pm 06:09 PM
The article compares top AI chatbots like ChatGPT, Gemini, and Claude, focusing on their unique features, customization options, and performance in natural language processing and reliability.
 Top AI Writing Assistants to Boost Your Content Creation
Apr 02, 2025 pm 06:11 PM
Top AI Writing Assistants to Boost Your Content Creation
Apr 02, 2025 pm 06:11 PM
The article discusses top AI writing assistants like Grammarly, Jasper, Copy.ai, Writesonic, and Rytr, focusing on their unique features for content creation. It argues that Jasper excels in SEO optimization, while AI tools help maintain tone consist
 How to Access Falcon 3? - Analytics Vidhya
Mar 31, 2025 pm 04:41 PM
How to Access Falcon 3? - Analytics Vidhya
Mar 31, 2025 pm 04:41 PM
Falcon 3: A Revolutionary Open-Source Large Language Model Falcon 3, the latest iteration in the acclaimed Falcon series of LLMs, represents a significant advancement in AI technology. Developed by the Technology Innovation Institute (TII), this open
 Choosing the Best AI Voice Generator: Top Options Reviewed
Apr 02, 2025 pm 06:12 PM
Choosing the Best AI Voice Generator: Top Options Reviewed
Apr 02, 2025 pm 06:12 PM
The article reviews top AI voice generators like Google Cloud, Amazon Polly, Microsoft Azure, IBM Watson, and Descript, focusing on their features, voice quality, and suitability for different needs.
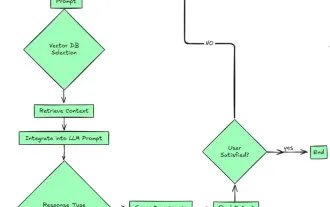 Top 7 Agentic RAG System to Build AI Agents
Mar 31, 2025 pm 04:25 PM
Top 7 Agentic RAG System to Build AI Agents
Mar 31, 2025 pm 04:25 PM
2024 witnessed a shift from simply using LLMs for content generation to understanding their inner workings. This exploration led to the discovery of AI Agents – autonomous systems handling tasks and decisions with minimal human intervention. Buildin
