
Currently, commonly used browsers IE, Chrome, and Firefox have corresponding script debugging functions. As we in the .NET camp, it is enough to learn how to debug JS in IE. After mastering the debugging methods in IE, the debugging methods in Chrome and Firefox also become quite simple.
Debugging in F12 Developer ToolsOpen the IE browser and press the F12 key to open the developer tools. This is IE's built-in developer tool, which is convenient for developers to track and debug web resources such as HTML, CSS, and Javascript.

If it is not pinned to the bottom of the webpage when you open it, you can click the button in the menu bar in the upper right corner to complete it.

We see that there are several tabs in this tool window, namely: HTML, CSS, console, script, profiler and network. Click on each tab to perform the corresponding task.
In the HTML tag window, the operations performed by the buttons in the toolbar are as follows:
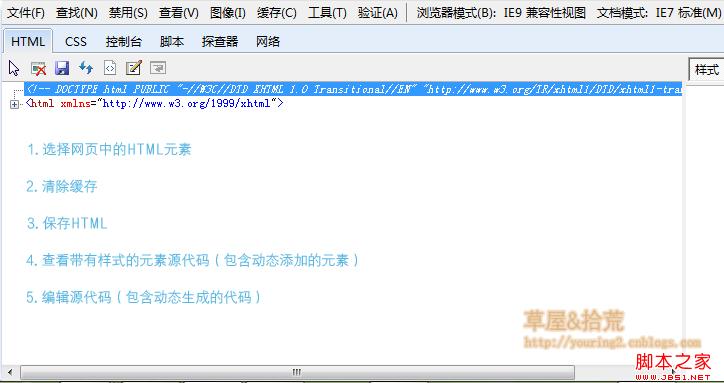
The CSS tag is used to view styles; the console displays various output information of JS in the web page, including error messages, user logs, etc.; open the script tab, which is what we want.
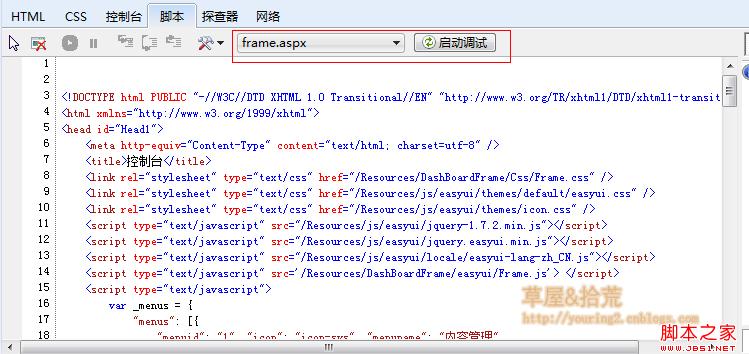
I used a yellow rectangle to select two controls in the picture. The drop-down list on the left is used to select files, and the button on the right is used to start debugging. When you click to start debugging, the debugger will maximize the window. We find the location that needs to be debugged in the selected file and click on the left sidebar to add a breakpoint to debug.
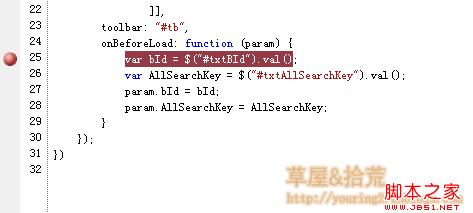
When a program runs to our breakpoint, it can be debugged.
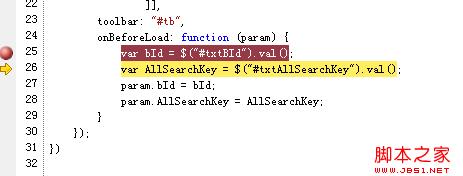
Here, we can use shortcut keys to operate. The commonly used shortcut keys are as follows:
F9: Add/remove breakpoints
F10: Step by step, that is, skip the methods, expressions, etc. in the statement
F11: Statement-by-statement debugging, that is, single-step debugging, will jump into methods and expressions to perform statement-by-statement tracking debugging
During the execution process, if we want to execute immediate code, we need to enter the code in the right pane and press Enter.

If you want to execute multiple lines of code, click the double arrow on the right side of the run button to turn on the multi-line mode. I won't take pictures anymore.
This method of debugging directly in the browser is also applicable to Google Chrome and FireFox FireDebug, but there are some differences in the details, and the main functions are the same.
Press the F12 key to enter the developer tools, where you can view source code, styles and js.

Click the Scripts button to open this debugging window, which contains the source code of the script file in the web page. Click the button on the left to open the side window for selecting the file. There are debugging tool buttons on the right side, but I don’t like these pure English interfaces, so most of the debugging is still done under IE. And it will be transferred to VS under IE.
Now I will introduce how to debug our JS code in VS.
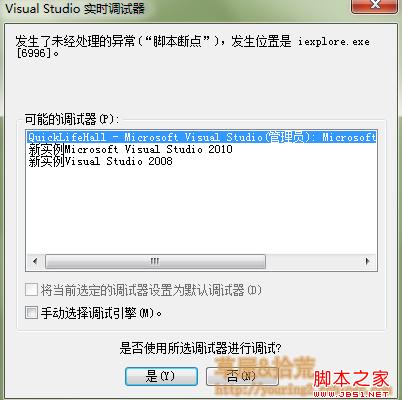
Use debugger keyword for debuggingThis method is very simple. We only need to add the debugger keyword where debugging is performed. Then when the browser runs to this keyword, it will prompt whether to turn on debugging. We can choose yes. For this kind of debugging, you can choose a debugging tool. You can choose whether to open a new VS or debug in an existing VS. I personally prefer this debugging method.
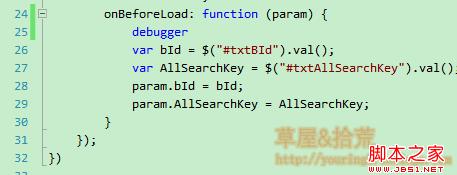
When we run this program, a debugging prompt window will pop up:
If your browser does not pop up this window, you need to make some simple settings and open Internet options:
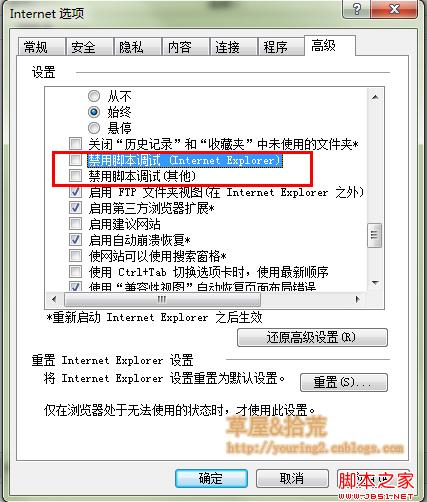
Just uncheck the two items in the red box.
After setting, you can use the debugger keyword for debugging; after entering such a setting, we can also capture unexpected errors for tracking and debugging.
Okay, this article is introduced here. If you don’t understand anything, please communicate with me. Debugging is a practical process. Only by using it many times can you master the methods and techniques.
 Blue screen code 0x000009c
 A collection of common computer commands
 You need permission from admin to make changes to this file
 Tutorial on turning off Windows 11 Security Center
 How to set up a domain name that automatically jumps
 What are the virtual currencies that may surge in 2024?
 The reason why header function returns 404 failure
 How to use js code


