
 Web Front-end
JS Tutorial
The combination of jQuery animate and CSS3 achieves the slow motion chasing effect with source code download_jquery
Web Front-end
JS Tutorial
The combination of jQuery animate and CSS3 achieves the slow motion chasing effect with source code download_jquery
The combination of jQuery animate and CSS3 achieves the slow motion chasing effect with source code download_jquery

Both CSS3 and jquery can achieve the easing chasing effect, but considering the compatibility of the browser, it is recommended to use the jquery animate method to achieve it.
Let me show you the implementation effect as follows:
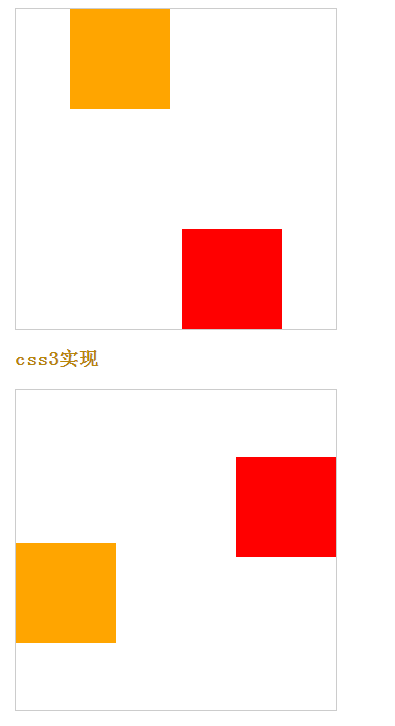
Effect demonstration Source code download
Referenced file: jquery-1.11.1.min.js
html
<div id="container">
<div id="first"></div>
<div id="second"></div>
</div>
jquery
var $first=$('#first');
var $second=$('#second');
(function(){
move1();
move2();
})()
function move1(){
$first.animate({
"left":220,
"top": 0
},400).animate({
"left":220,
"top":220
},400).animate({
"left":0,
"top":220
},400).animate({
"left":0,
"top":0
},function(){
move1();
})
}
function move2(){
$second.animate({
"right":220,
"bottom": 0
},400).animate({
"right":220,
"bottom":220
},400).animate({
"right":0,
"bottom":220
},400).animate({
"right":0,
"bottom":0
},function(){
move2();
})
}The above is the combination of jQuery animate and CSS3 introduced by the editor to achieve the slow motion chasing effect. I hope it will be helpful to everyone!

Hot AI Tools

Undresser.AI Undress
AI-powered app for creating realistic nude photos

AI Clothes Remover
Online AI tool for removing clothes from photos.

Undress AI Tool
Undress images for free

Clothoff.io
AI clothes remover

AI Hentai Generator
Generate AI Hentai for free.

Hot Article
Hot Tools

Notepad++7.3.1
Easy-to-use and free code editor

SublimeText3 Chinese version
Chinese version, very easy to use

Zend Studio 13.0.1
Powerful PHP integrated development environment

Dreamweaver CS6
Visual web development tools

SublimeText3 Mac version
God-level code editing software (SublimeText3)
Hot Topics
 1376
1376
 52
52

 How do I create and publish my own JavaScript libraries?
Mar 18, 2025 pm 03:12 PM
How do I create and publish my own JavaScript libraries?
Mar 18, 2025 pm 03:12 PM
Article discusses creating, publishing, and maintaining JavaScript libraries, focusing on planning, development, testing, documentation, and promotion strategies.
 How do I optimize JavaScript code for performance in the browser?
Mar 18, 2025 pm 03:14 PM
How do I optimize JavaScript code for performance in the browser?
Mar 18, 2025 pm 03:14 PM
The article discusses strategies for optimizing JavaScript performance in browsers, focusing on reducing execution time and minimizing impact on page load speed.
 What should I do if I encounter garbled code printing for front-end thermal paper receipts?
Apr 04, 2025 pm 02:42 PM
What should I do if I encounter garbled code printing for front-end thermal paper receipts?
Apr 04, 2025 pm 02:42 PM
Frequently Asked Questions and Solutions for Front-end Thermal Paper Ticket Printing In Front-end Development, Ticket Printing is a common requirement. However, many developers are implementing...
 How do I debug JavaScript code effectively using browser developer tools?
Mar 18, 2025 pm 03:16 PM
How do I debug JavaScript code effectively using browser developer tools?
Mar 18, 2025 pm 03:16 PM
The article discusses effective JavaScript debugging using browser developer tools, focusing on setting breakpoints, using the console, and analyzing performance.
 How do I use source maps to debug minified JavaScript code?
Mar 18, 2025 pm 03:17 PM
How do I use source maps to debug minified JavaScript code?
Mar 18, 2025 pm 03:17 PM
The article explains how to use source maps to debug minified JavaScript by mapping it back to the original code. It discusses enabling source maps, setting breakpoints, and using tools like Chrome DevTools and Webpack.
 TypeScript for Beginners, Part 2: Basic Data Types
Mar 19, 2025 am 09:10 AM
TypeScript for Beginners, Part 2: Basic Data Types
Mar 19, 2025 am 09:10 AM
Once you have mastered the entry-level TypeScript tutorial, you should be able to write your own code in an IDE that supports TypeScript and compile it into JavaScript. This tutorial will dive into various data types in TypeScript. JavaScript has seven data types: Null, Undefined, Boolean, Number, String, Symbol (introduced by ES6) and Object. TypeScript defines more types on this basis, and this tutorial will cover all of them in detail. Null data type Like JavaScript, null in TypeScript
 How do I use Java's collections framework effectively?
Mar 13, 2025 pm 12:28 PM
How do I use Java's collections framework effectively?
Mar 13, 2025 pm 12:28 PM
This article explores effective use of Java's Collections Framework. It emphasizes choosing appropriate collections (List, Set, Map, Queue) based on data structure, performance needs, and thread safety. Optimizing collection usage through efficient
 Getting Started With Chart.js: Pie, Doughnut, and Bubble Charts
Mar 15, 2025 am 09:19 AM
Getting Started With Chart.js: Pie, Doughnut, and Bubble Charts
Mar 15, 2025 am 09:19 AM
This tutorial will explain how to create pie, ring, and bubble charts using Chart.js. Previously, we have learned four chart types of Chart.js: line chart and bar chart (tutorial 2), as well as radar chart and polar region chart (tutorial 3). Create pie and ring charts Pie charts and ring charts are ideal for showing the proportions of a whole that is divided into different parts. For example, a pie chart can be used to show the percentage of male lions, female lions and young lions in a safari, or the percentage of votes that different candidates receive in the election. Pie charts are only suitable for comparing single parameters or datasets. It should be noted that the pie chart cannot draw entities with zero value because the angle of the fan in the pie chart depends on the numerical size of the data point. This means any entity with zero proportion
