

ECMAScript creates your own js class library_javascript skills

The most interesting and powerful thing in ECMAScript is the function. Recently, when I was improving my js library, I found that we often use functions, but very few people understand the functions of ECMAScript functions.
1: What is a function?
ECMAScript functions are actually objects. Each function is an instance of the Function type and has properties and methods. Since functions are objects, the function name is actually a pointer to the function object and will not be bound to a certain function. .
2: Method of creating a function
(1):function Person(name)
{
return name;
}
(2):var Person=function(name)
}
(3): var Person=new function("name","return name"); (not recommended, ECMAScript will parse it twice so it is not recommended)
3: The difference between function declarations and function expressions ECMAScript does not parse function declarations and function expressions equally. The parser will read the function declaration first and make it appear before any code. Available.
Example:
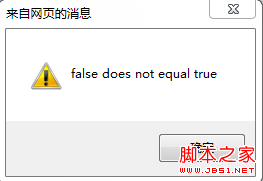
function assert(value, msg) {
if (!value) {
alert (msg || (value " does not equal true"));
}
}
 The function expression will not be parsed until this line is executed
 var assert= function (value, msg) {
if (!value) {
alert (msg || ( value " does not equal true"));
}
}
4: Understand this attribute this attribute is The properties we often use have roughly similar behavior to Java, C#, and PHP.
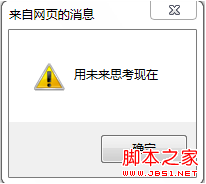
window.name = "Without thinking now;
showName();
function showName() {
alert(this.name);
}
5: Create your own class library plug-in A brief introduction to functions is not enough for understanding functions, such as constructor mode, prototype mode, prototype Chains and so on take a lot of time to understand.
Create classes
var extclass = function () {
//Receive parameters passed by attributes
this.init.apply(this, arguments);
}
//Add custom attributes to the class
extclass.prototype.init = function () { };
//Define an alias for prototypr?
extclass.fn = extclass.prototype;
//Define the alias of the class?
extclass.fn.parent = extclass;
//Add attributes to the class
extclass.extend = function (obj) {
var extended = obj.extended;
for (var i in obj) {
extclass.fn[i] = obj[i];
}
if (extended) extended(extclass);
};
//Add attributes to the instance
extclass.include = function (obj) {
var included = obj.included;
for (var i in obj) {
extclass.fn[i] = obj [i];
}
if (included) included(extclass);
}
return extclass;
}

Hot AI Tools

Undresser.AI Undress
AI-powered app for creating realistic nude photos

AI Clothes Remover
Online AI tool for removing clothes from photos.

Undress AI Tool
Undress images for free

Clothoff.io
AI clothes remover

Video Face Swap
Swap faces in any video effortlessly with our completely free AI face swap tool!

Hot Article
Hot Tools

Notepad++7.3.1
Easy-to-use and free code editor

SublimeText3 Chinese version
Chinese version, very easy to use

Zend Studio 13.0.1
Powerful PHP integrated development environment

Dreamweaver CS6
Visual web development tools

SublimeText3 Mac version
God-level code editing software (SublimeText3)
Hot Topics
 1386
1386
 52
52

 How to create a cumulative curve graph in Python?
Aug 23, 2023 pm 08:33 PM
How to create a cumulative curve graph in Python?
Aug 23, 2023 pm 08:33 PM
The ogive graph graphically represents the cumulative distribution function (CDF) of a set of data, sometimes called a cumulative frequency curve. It is used to examine data distribution and discover patterns and trends. Matplotlib, Pandas, and Numpy are some of the libraries and tools provided by Python for creating otive graphics. In this tutorial, we will look at how to use Matplotlib to generate ogive graphics in Python. To create a cumulative curve chart, we need to import the required libraries. In this example we will use Matplotlib, Pandas and Numpy. Matplotlib is a popular data visualization library for creating in Python
 How to create a constant in Python?
Aug 29, 2023 pm 05:17 PM
How to create a constant in Python?
Aug 29, 2023 pm 05:17 PM
Constants and variables are used to store data values in programming. A variable usually refers to a value that can change over time. A constant is a type of variable whose value cannot be changed during program execution. There are only six built-in constants available in Python, they are False, True, None, NotImplemented, Ellipsis(...) and __debug__. Apart from these constants, Python does not have any built-in data types to store constant values. Example An example of a constant is demonstrated below - False=100 outputs SyntaxError:cannotassigntoFalseFalse is a built-in constant in Python that is used to store boolean values
 How to personalize your iPhone on the latest iOS 17
Sep 21, 2023 am 08:17 AM
How to personalize your iPhone on the latest iOS 17
Sep 21, 2023 am 08:17 AM
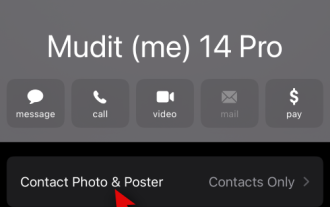
How to Personalize Calls on iPhone Apple’s iOS 17 introduces a new feature called Contact Posters that allows you to personalize the look of your call screen on your iPhone. This feature allows you to design a poster using selected photos, colors, fonts, and Memoji as contact cards. So when you make a call, your custom image will appear on the recipient's iPhone exactly as you envisioned. You can choose to share your unique contact poster with all your saved contacts, or choose who can see it. Likewise, during a call exchange, you will also see other people's contact posters. Additionally, Apple lets you set specific contact photos for individual contacts, making calls from those contacts
 How to create a folder on Realme Phone?
Mar 23, 2024 pm 02:30 PM
How to create a folder on Realme Phone?
Mar 23, 2024 pm 02:30 PM
Title: Realme Phone Beginner’s Guide: How to Create Folders on Realme Phone? In today's society, mobile phones have become an indispensable tool in people's lives. As a popular smartphone brand, Realme Phone is loved by users for its simple and practical operating system. In the process of using Realme phones, many people may encounter situations where they need to organize files and applications on their phones, and creating folders is an effective way. This article will introduce how to create folders on Realme phones to help users better manage their phone content. No.
 How to create pixel art in GIMP
Feb 19, 2024 pm 03:24 PM
How to create pixel art in GIMP
Feb 19, 2024 pm 03:24 PM
This article will interest you if you are interested in using GIMP for pixel art creation on Windows. GIMP is a well-known graphics editing software that is not only free and open source, but also helps users create beautiful images and designs easily. In addition to being suitable for beginners and professional designers alike, GIMP can also be used to create pixel art, a form of digital art that utilizes pixels as the only building blocks for drawing and creating. How to Create Pixel Art in GIMP Here are the main steps to create pixel pictures using GIMP on a Windows PC: Download and install GIMP, then launch the application. Create a new image. Resize width and height. Select the pencil tool. Set the brush type to pixels. set up
 How to create a family with Gree+
Mar 01, 2024 pm 12:40 PM
How to create a family with Gree+
Mar 01, 2024 pm 12:40 PM
Many friends expressed that they want to know how to create a family in Gree+ software. Here is the operation method for you. Friends who want to know more, come and take a look with me. First, open the Gree+ software on your mobile phone and log in. Then, in the options bar at the bottom of the page, click the "My" option on the far right to enter the personal account page. 2. After coming to my page, there is a "Create Family" option under "Family". After finding it, click on it to enter. 3. Next jump to the page to create a family, enter the family name to be set in the input box according to the prompts, and click the "Save" button in the upper right corner after entering it. 4. Finally, a "save successfully" prompt will pop up at the bottom of the page, indicating that the family has been successfully created.
 How to create user interface via Python?
Aug 26, 2023 am 09:17 AM
How to create user interface via Python?
Aug 26, 2023 am 09:17 AM
In this article, we will learn how to create user interface using python. What is a graphical user interface? The term "graphical user interface" (or "GUI") refers to a set of visual element items that can be interacted with in computer software to display information and interact. In response to human input, objects may change appearance characteristics such as color, size, and visibility. Graphical components such as icons, cursors, and buttons can be enhanced with audio or visual effects (such as transparency) to create graphical user interfaces (GUIs). If you want more people to use your platform, you need to make sure it has a good user interface. This is because the combination of these factors can greatly affect the quality of service provided by your app or website. Python is widely used by developers because it provides
 How to create a Gantt chart using Highcharts
Dec 17, 2023 pm 07:23 PM
How to create a Gantt chart using Highcharts
Dec 17, 2023 pm 07:23 PM
How to use Highcharts to create a Gantt chart requires specific code examples. Introduction: The Gantt chart is a chart form commonly used to display project progress and time management. It can visually display the start time, end time and progress of the task. Highcharts is a powerful JavaScript chart library that provides rich chart types and flexible configuration options. This article will introduce how to use Highcharts to create a Gantt chart and give specific code examples. 1. Highchart
