

单链表crud操作之_水浒英雄排行算法_学习笔记_源代码图解_PPT文档整理

singleLink.php
[php]

Hot AI Tools

Undresser.AI Undress
AI-powered app for creating realistic nude photos

AI Clothes Remover
Online AI tool for removing clothes from photos.

Undress AI Tool
Undress images for free

Clothoff.io
AI clothes remover

Video Face Swap
Swap faces in any video effortlessly with our completely free AI face swap tool!

Hot Article
Hot Tools

Notepad++7.3.1
Easy-to-use and free code editor

SublimeText3 Chinese version
Chinese version, very easy to use

Zend Studio 13.0.1
Powerful PHP integrated development environment

Dreamweaver CS6
Visual web development tools

SublimeText3 Mac version
God-level code editing software (SublimeText3)
Hot Topics
 1389
1389
 52
52

 Implementing Machine Learning Algorithms in C++: Common Challenges and Solutions
Jun 03, 2024 pm 01:25 PM
Implementing Machine Learning Algorithms in C++: Common Challenges and Solutions
Jun 03, 2024 pm 01:25 PM
Common challenges faced by machine learning algorithms in C++ include memory management, multi-threading, performance optimization, and maintainability. Solutions include using smart pointers, modern threading libraries, SIMD instructions and third-party libraries, as well as following coding style guidelines and using automation tools. Practical cases show how to use the Eigen library to implement linear regression algorithms, effectively manage memory and use high-performance matrix operations.
 Explore the underlying principles and algorithm selection of the C++sort function
Apr 02, 2024 pm 05:36 PM
Explore the underlying principles and algorithm selection of the C++sort function
Apr 02, 2024 pm 05:36 PM
The bottom layer of the C++sort function uses merge sort, its complexity is O(nlogn), and provides different sorting algorithm choices, including quick sort, heap sort and stable sort.
 Detailed method to create animation effect of finger erasing displayed text in PPT
Mar 26, 2024 pm 09:46 PM
Detailed method to create animation effect of finger erasing displayed text in PPT
Mar 26, 2024 pm 09:46 PM
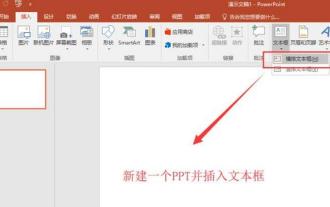
1. Create a new PPT presentation, select the horizontal text box in the insert menu, insert a horizontal text box on the slide page, and enter the text content in the text box. 2. Select the created text box or select all the text content in the text box. Under the start menu, set the text font, font size and other related text font attributes. 3. Find the picture in the insert menu, click the picture, select the material picture of a finger that you found before and import it to the slide page, select the inserted picture, reduce it to the appropriate size and place it in the appropriate position. 4. Select the text box, click on the animation menu, find the [Erase] animation effect in the animation menu, click Erase to apply this effect to the text box, and set the erasing animation direction to
 Improved detection algorithm: for target detection in high-resolution optical remote sensing images
Jun 06, 2024 pm 12:33 PM
Improved detection algorithm: for target detection in high-resolution optical remote sensing images
Jun 06, 2024 pm 12:33 PM
01 Outlook Summary Currently, it is difficult to achieve an appropriate balance between detection efficiency and detection results. We have developed an enhanced YOLOv5 algorithm for target detection in high-resolution optical remote sensing images, using multi-layer feature pyramids, multi-detection head strategies and hybrid attention modules to improve the effect of the target detection network in optical remote sensing images. According to the SIMD data set, the mAP of the new algorithm is 2.2% better than YOLOv5 and 8.48% better than YOLOX, achieving a better balance between detection results and speed. 02 Background & Motivation With the rapid development of remote sensing technology, high-resolution optical remote sensing images have been used to describe many objects on the earth’s surface, including aircraft, cars, buildings, etc. Object detection in the interpretation of remote sensing images
 Detailed steps for making a continuous block flow chart using PPT
Mar 26, 2024 pm 09:50 PM
Detailed steps for making a continuous block flow chart using PPT
Mar 26, 2024 pm 09:50 PM
1. Open PPT and enter its main interface. 2. Delete the Click here to add title and subtitle input boxes, and a blank page will appear. 3. Click the Insert menu and select the SmartArt tool. 4. Click Process on the Select SmartArt Graphics page, select Continuous Block Process, and press OK. 5. Insert a continuous block process into PPT. 6. Fill in text for continuous block processes. 7. If the input box is not enough, select the last shape, right-click on it, select Add Shape, and click to add a shape later. 8. Enter text content for the newly added shape. 9. At this point, a continuous block process has been created in PPT.
 Steps to create a mixed line and column chart in PPT
Mar 26, 2024 pm 09:26 PM
Steps to create a mixed line and column chart in PPT
Mar 26, 2024 pm 09:26 PM
1. Insert the data chart into the PPT and select [Clustered Column Chart] as the type. 2. Enter the source data and use only two columns of data. For example, the first column is monthly data and the second column is monthly cumulative data. 3. Change the chart type of the cumulative data series, click "Change Chart Type" under Chart Tools, click [Combine], select the line chart with data markers for the cumulative data, and check the secondary axis. 4. After clicking OK, you get Basic combination graphics. 5. Add data labels for column charts and line charts. And set different colors to show distinction. 6. Further beautify the data chart, delete unnecessary elements, highlight information, and get the final chart.
 Application of algorithms in the construction of 58 portrait platform
May 09, 2024 am 09:01 AM
Application of algorithms in the construction of 58 portrait platform
May 09, 2024 am 09:01 AM
1. Background of the Construction of 58 Portraits Platform First of all, I would like to share with you the background of the construction of the 58 Portrait Platform. 1. The traditional thinking of the traditional profiling platform is no longer enough. Building a user profiling platform relies on data warehouse modeling capabilities to integrate data from multiple business lines to build accurate user portraits; it also requires data mining to understand user behavior, interests and needs, and provide algorithms. side capabilities; finally, it also needs to have data platform capabilities to efficiently store, query and share user profile data and provide profile services. The main difference between a self-built business profiling platform and a middle-office profiling platform is that the self-built profiling platform serves a single business line and can be customized on demand; the mid-office platform serves multiple business lines, has complex modeling, and provides more general capabilities. 2.58 User portraits of the background of Zhongtai portrait construction
 Learn the main function in Go language from scratch
Mar 27, 2024 pm 05:03 PM
Learn the main function in Go language from scratch
Mar 27, 2024 pm 05:03 PM
Title: Learn the main function in Go language from scratch. As a simple and efficient programming language, Go language is favored by developers. In the Go language, the main function is an entry function, and every Go program must contain the main function as the entry point of the program. This article will introduce how to learn the main function in Go language from scratch and provide specific code examples. 1. First, we need to install the Go language development environment. You can go to the official website (https://golang.org
