
 Web Front-end
JS Tutorial
Native Js realizes the slide effect of time points evenly distributed according to the data source (encapsulated)_javascript skills
Web Front-end
JS Tutorial
Native Js realizes the slide effect of time points evenly distributed according to the data source (encapsulated)_javascript skills
Native Js realizes the slide effect of time points evenly distributed according to the data source (encapsulated)_javascript skills

It is recommended to view it in standard browsers such as Chrom, Firefox, Opera, Safari, etc. There are no shadows and rounded corners under Ie.
implements the total number of items based on the source data (in the example, a JSON data group), both The separated time points are displayed on the timeline in a smooth rightward animation. When the mouse passes over the time point, the corresponding date and title are displayed. The mouse passes event fully considers the user experience. When the user moves quickly (unintentionally) from When the time point is crossed, the corresponding event will not be triggered.
For related method descriptions and usage, please see the notes below or leave comments. You are also welcome to find bugs and submit them. 
Js core code click hereView sample
var JSONData=[{...},{...},...];//Data source, everything is born and dies because of it
function iTimePoint(iTimeSlideId, dateId, timeLineId, titleTop, titleId, defaultShow){
/* Incoming parameter description:
* iTimeSlideId: peripheral ID name. In this sample DOM #itimeslide;
* dateId: date ID name. In this sample DOM #date;
* timeLineId: Time point distribution ID name. In this sample DOM #timeline;
* titleTop: The ID name of the small triangle above the title container. In this sample DOM #titletop;
* titleId: Title container ID name. In this sample DOM #title;
* defaultShow: Set the initial display time point, the default is 0, no value can be passed
*/
//Parameter judgment, for testing, can be deleted after successful operation
if (arguments.length < 5 || arguments.length>6) {
alert('Parameter input error, please pass Enter 5 or 6 values! :)');
return false;
}
//General method
var iBase = {
//document.getElementById
Id: function(name){
return document.getElementById(name);
},
//Time point animation display
PointSlide: function(elem, val){
//Can Control the sliding speed by modifying 5 in i =5
for (var i = 0; i <= 100; i = 5) {
(function(){
//This pos definition is very important , if the i obtained directly by using the closure is not the above i
var pos = i;
//Smooth movement
setTimeout(function(){
elem.style.left = pos * val / 100 'px';
}, (pos 1) * 10);
})();
}
},
//Add styles to elements
AddClass: function (elem, val){
//If the element has no class, assign it directly
if (!elem.className) {
elem.className = val;
}else {
//Otherwise Add a new class by adding spaces
var oVal = elem.className;
oVal = ' ';
oVal = val;
elem.className = val;
}
},
//Get element index
Index: function(cur, obj){
for (var i = 0; i < obj.length; i ) {
if (obj[i] = = cur) {
return i;
}
}
}
}
//The entire function variable definition area
var dataLen = JSONData.length;
var iTimeSilde = iBase.Id(iTimeSlideId);
var date = iBase.Id(dateId);
var timeLine = iBase.Id(timeLineId);
var titletop = iBase.Id(titleTop);
var title = iBase.Id(titleId);
var iTimeSildeW = iTimeSilde.offsetWidth;//actual width of slide area
var timePoint = document.createElement('ul');//used to store time points ul
var timePointLeft = null;//The distance of the time point relative to the left side of the parent element
var timePointLeftCur = null;//The distance between every two time points
var pointIndex = 0;//The time point is in the queue Index value
var defaultShow = defaultShow || 0;//Default display time
var clearFun=null;//Abort execution when the user swipes unconsciously
var that=null;
/ /Generate corresponding time point html based on the number of data items
for (var i = 0; i < dataLen; i ) {
timePoint.innerHTML = '';
}
//Insert time points into the timeline DIV
timeLine.appendChild(timePoint)
var timePoints = timeLine.getElementsByTagName('li');
//Smooth display of time points
for (var i = 0; i < timePoints.length; i ) {
//The distance between each two time points
timePointLeftCur = parseInt(iTimeSildeW / (dataLen 1));
/ /Calculate the left margin of the corresponding time point
timePointLeft = (i 1) * timePointLeftCur;
//Initialization of time point animation form
iBase.PointSlide(timePoints[i], timePointLeft);
//Initialization Display time points
setTimeout(function(){
timePoints[defaultShow].onmouseover();
}, 1200);
//Get the default class value of time point and prepare for mouse events
timePoints[i].oldClassName = timePoints[i].className;
timePoints[i].onmouseover = function(){
that = this;//Make sure this in clearFun is the current this
//Improve user experience, do not execute the function when the user swipes unconsciously
clearFun=setTimeout(function(){
//Calculate the index value of the current time point to prepare for the mouse swipe
pointIndex = iBase.Index(that, timePoints);
//Remove the highlight style of the previous time point
for (var m = 0; m < timePoints.length; m ) {
if (m ! = pointIndex) {
timePoints[m].className = timePoints[m].oldClassName
}
}
//Load the highlight style for the current time point
iBase.AddClass(that, 'hover');
//Switch date and title value
date.innerHTML = '' (JSONData[pointIndex]['date'] || '') '< ;EM>';
title.innerHTML = '' (JSONData[pointIndex] ['title'] || '') '';
//Change the position of the date and title. The number subtracted here can be adjusted according to the actual style
date.style.left = ((pointIndex 1) * timePointLeftCur - 25) 'px';
titletop.style.left = ((pointIndex 1) * timePointLeftCur 6) 'px';
//When the left margin of the title box is the same as the title box When the sum of widths is greater than the peripheral width, the right side is the absolute point
if ((title.offsetWidth (pointIndex 1) * timePointLeftCur) < iTimeSildeW) {
title.style.left = ((pointIndex 1) * timePointLeftCur - timePointLeftCur) 'px';
}else {
title.style.left = (iTimeSildeW - title.offsetWidth) 'px';
}
//Display date/time point/title
date.style.display = 'block' ;
titletop.style.display = 'block';
title.style.display = 'block';
},200);//200 is the time considered to be passed unconsciously and can be adjusted by yourself
}
timePoints[i].onmouseout = function(){
//If the dwell time is less than 200ms, it is considered as an unconscious swipe and the function is aborted
clearTimeout(clearFun);
}
}
}

Hot AI Tools

Undresser.AI Undress
AI-powered app for creating realistic nude photos

AI Clothes Remover
Online AI tool for removing clothes from photos.

Undress AI Tool
Undress images for free

Clothoff.io
AI clothes remover

AI Hentai Generator
Generate AI Hentai for free.

Hot Article
Hot Tools

Notepad++7.3.1
Easy-to-use and free code editor

SublimeText3 Chinese version
Chinese version, very easy to use

Zend Studio 13.0.1
Powerful PHP integrated development environment

Dreamweaver CS6
Visual web development tools

SublimeText3 Mac version
God-level code editing software (SublimeText3)
Hot Topics
 1359
1359
 52
52

 Power BI cannot connect, an error was encountered while trying to connect
Feb 18, 2024 pm 05:48 PM
Power BI cannot connect, an error was encountered while trying to connect
Feb 18, 2024 pm 05:48 PM
PowerBI may encounter difficulties when it cannot connect to a data source that is an XLS, SQL, or Excel file. This article will explore possible solutions to help you resolve this issue. This article will guide you on what to do if you encounter errors or connection failures during the connection process. So, if you are facing this problem, keep reading and we will provide you with some useful suggestions. What is the gateway connection error in PowerBI? Gateway errors in PowerBI are often caused by a mismatch between the data source information and the underlying dataset. To solve this problem, you need to ensure that the data source defined on the local data gateway is accurate and consistent with the data source specified in PowerBI desktop. PowerBI cannot connect
 How to fix background slideshow not working in Windows 11, 10
May 05, 2023 pm 07:16 PM
How to fix background slideshow not working in Windows 11, 10
May 05, 2023 pm 07:16 PM
On Windows 11/10 systems, some users claim that the slideshow on the desktop background has stopped working. Users are confused as to why photos on their laptop's background screen no longer slide. The reasons for this issue where slideshows are not working are described below. A third-party desktop customization application is installed. In power options, the desktop background slideshow setting is paused. The folder containing the background images is deleted. The screen may turn off after the slideshow is complete. After investigating the above reasons, we have created a list of fixes that will undoubtedly help users resolve the issue. Workaround – A deactivated window may be one of the causes of this issue. So, try activating Windows and check if the issue is resolved. Try to apply it via Settings
 Why does the slideshow have black borders when playing in full screen?
Oct 20, 2023 pm 03:25 PM
Why does the slideshow have black borders when playing in full screen?
Oct 20, 2023 pm 03:25 PM
There may be black borders in the full-screen slideshow due to screen resolution mismatch, image size mismatch, incorrect zoom mode settings, monitor settings issues, slide design issues, etc. Detailed introduction: 1. Screen resolution does not match. A common reason for black borders is that the screen resolution does not match the slide size. When the size of the slide is smaller than the screen resolution, black borders will appear during playback. The solution is to adjust Size the slide so that it matches the screen resolution. In PowerPoint, you can select the "Design" tab, then click "Slide Size" and so on.
 How to create a slideshow with background music on Windows 11?
Apr 21, 2023 am 10:07 AM
How to create a slideshow with background music on Windows 11?
Apr 21, 2023 am 10:07 AM
Slideshows are a great way to organize pictures on your Windows 11 computer. Sometimes, Windows users may face some kind of hardware limitation or system update and they need a way to store their files so that they are not accidentally deleted or lost. Additionally, it makes sorting and displaying photos much easier than having to manually show them to people by scrolling through them one by one. Slideshows are also a great way to bring together photos from different sources (camera, phone, USB drive) into an easy-to-enjoy format. Fortunately, you can use some useful third-party applications to create these slideshows without being forced to use tools like PowerPoint. The app is suitable for business presentations, but Pow
 How to convert PowerPoint to Google Slides?
Apr 22, 2023 pm 03:19 PM
How to convert PowerPoint to Google Slides?
Apr 22, 2023 pm 03:19 PM
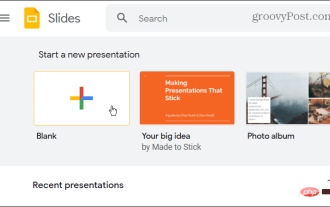
How to Convert PowerPoint to Google Slides One of the easiest ways to convert a complete PowerPoint presentation to Google Slides is to upload it. By uploading a PowerPoint (PPT or PPTX) file to Google Slides, the file will automatically be converted into a format suitable for Google Slides. To convert PowerPoint to Google Slides directly, follow these steps: Sign in to your Google account, go to the Google Slides page, and click on the blank space under the "Start a new presentation" section. In the new presentation page, click File&g
 How to hide text until clicked in Powerpoint
Apr 14, 2023 pm 04:40 PM
How to hide text until clicked in Powerpoint
Apr 14, 2023 pm 04:40 PM
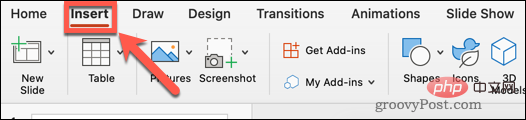
How to hide text before any click in PowerPoint If you want text to appear when you click anywhere on a PowerPoint slide, setting it up is quick and easy. To hide text before clicking any button in PowerPoint: Open your PowerPoint document and click the Insert menu. Click on New Slide. Choose Blank or one of the other presets. Still in the Insert menu, click Text Box. Drag a text box onto the slide. Click the text box and enter your
 Introduction to the method of inserting heptagons into PPT slides
Mar 26, 2024 pm 07:46 PM
Introduction to the method of inserting heptagons into PPT slides
Mar 26, 2024 pm 07:46 PM
1. Open the PPT slide document, and in the [Outline, Slide] column on the left side of the PPT, click to select the slide where you want to insert the basic [shape]. 2. After selecting, select the [Insert] menu in the function menu bar above the PPT and click. 3. After clicking the [Insert] menu, the [Insert] submenu bar pops up below the function menu bar. Select the [Shape] menu in the [Insert] submenu bar. 4. Click the [Shape] menu to pop up the preset shape type selection page. 5. In the shape type selection page, select the [Heptagon] shape and click. 6. After clicking, move the mouse to the slide editing interface, press the mouse to draw, and release the mouse after the drawing is completed. Complete the insertion of the [heptagon] shape.
 Steps to unify the theme color of PPT slides
Mar 26, 2024 pm 08:51 PM
Steps to unify the theme color of PPT slides
Mar 26, 2024 pm 08:51 PM
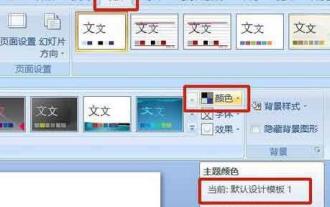
1. The color scheme is naturally related to design, so we click on the design toolbar and on the right side, you can see the color options. Point the mouse up, and you can see that the current theme color is: Default design template 1. 2. Click on this option, and the first one is the current color design. To change that, we're going to go down below the panel: New Theme Colors. 3. Click in, and in the column of colors that appear, you can see that there are three accent text colors, all of which are light and almost impossible to display on a light background. Among them is the text color in this example. 4. Click the drop-down arrow on the right side of the color to display the color selection panel. In order not to destroy the overall color matching, choose a dark color in the primary color system to replace the primary color. Replace the other two colors in the same way. 5. Compare the changed color with the original color. On the left is
