

A sudden jquery plug-in_jquery


One. Basic introduction
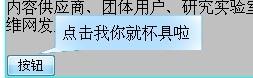
This jq plug-in mainly uses canvas to draw the appearance of this tip, and this tip can automatically adjust its size. Since it is drawn with canvas instead of a picture, it will not become blurry after adjustment. Something like that.
The main idea is to use a P tag to load the value of the title, and then place it in a canvas whose size changes according to the P. The difficulty is positioning.
It seems that when we don’t specify font-size at the beginning, Firefox can find a default font-size value, but Google Chrome cannot read the value, which is quite frustrating.
Please refer to the code comments for detailed instructions.
Two. Demo and code
(function($){
$.fn.polaTip=function(){
var tips={};//tip collection, create an object for each element in the matching set , this object saves some required information
//The tip below has nothing to do with the one above. It saves a canvas object, and this canvas is shared
var tip= $("") //text-align:center ;vertical-align:maddle;
var div=$("
div.appendTo(" body");
var cxt = tip[0].getContext("2d");
this.each(function(){
var $that=$(this);
var offset = $that.offset();
var setleft=offset.left;//Get the position relative to the page
var settop=offset.top;
var theTip={};
var title = $("
");
theTip.title=title;//There is one title for each element, save them in the tips array
var fontSize=16;
//var fontSize=parseInt(theTip.title.css("fontSize"));
title.css("opacity",0);//First hide the P of the title attribute of the element to be loaded by default
div.append (theTip.title);
titleString=$that.attr("title");//Get the title attribute
var titleStringLength=titleString.length;//Get the length of the title
$that.attr( "title","");
title.text(titleString);//The value of the element title is saved in the P just created
theTip.titleWidth= title.width();//After loading The width of P
theTip.that=$that;
if(this.id) {tips[this.id]=theTip;}
else{$that.addClass(Math.random() "" );tips[$that.attr("class")]=theTip;}//If there is an ID, use the ID as the key, if not, generate a random class as the key
if(theTip.titleWidth>250|| titleStringLength>(250/fontSize)){//If the title is too long, then wrap it
var rowLength=Math.sqrt(titleStringLength*(5/1))*fontSize;
toBreakWord( (rowLength* 1.3)/fontSize,theTip.title[0]);
theTip.title.css("width",rowLength);
}
else{theTip.title.css({"width":titleStringLength *fontSize 10});}//,whiteSpace:"nowrap"
$that.hover(
function(){
var theTip=null;
if(this.id){theTip= tips[this.id];}
else{theTip=tips[this.className];}//Get your own object in tips based on key
var title=theTip.title;
/*width High calculation*/
var height=title.height()*1.1 20;
var width=title.width()*1.1 20;
title.css({top:title.height()* 0.1*0.5 10 "px",left:width*0.1 2 "px"});
tip.css({height:height "px",width:width "px"});
var lingrad = cxt.createLinearGradient(0,0,0,150); //Linear gradient of canvas
lingrad.addColorStop(0, '#00ABEB');
lingrad.addColorStop(0.5, 'rgba(10, 150, 255, 0.9)');
cxt.strokeStyle=lingrad;
var radgrad = cxt.createRadialGradient(150,75,10,150,75,150); //Reflective gradient of canvas
radgrad.addColorStop(0, ' rgba(10, 150, 255, 0.3)');
radgrad.addColorStop(0.5, 'rgba(10, 150, 255, 0.3)');
radgrad.addColorStop(1, 'rgba(256,256,256, 0.5)');
cxt.lineJoin="round";//The shape of the angle when two lines form an angle
cxt.lineWidth=2;//Line width
cxt.clearRect(0, 0,300,150);//Clear the canvas, because the canvas is shared, you must clear the last thing
/*Draw the tip shape I want*/
cxt.beginPath();
cxt.moveTo( 30.5,5.5);
cxt.lineTo(285.5,5.5);
cxt.lineTo(285.5,135.5);
cxt.lineTo(75.5,135.5);
cxt.lineTo(2.5, 148.5);
cxt.lineTo(30.5,125.5);
cxt.lineTo(30.5,5.5);
cxt.stroke();
/*fill*/
cxt.fillStyle ="#fff";
cxt.fill();
cxt.fillStyle=radgrad;
cxt.fill();
for(var flagtip in tips)//Let the text of other tips Hide
{ flagtip=tips[flagtip];
if(flagtip==theTip){flagtip.title.css("opacity",1);}
else{
if(flagtip.title .css){flagtip.title.css("opacity",0);}
}
}
div.css({left:setleft $that.width() "px",top:settop -2*tip.height() "px",opacity:0,height:height,width:width});
div.stop();
div.animate({top:settop-tip.height () "px",opacity:1},500)
},
function(){
div.stop();
div.animate({top:settop-2*tip. height() "px",opacity:0},1000)
})//hover
})//each
}
})(jQuery)
$(function() {
$("div p").children().add("#Button1").polaTip();
})
A certain word break and line break function
function toBreakWord(intLen, obj)//function to break word and line break
{
var strContent=obj.innerHTML;
var strTemp="";
while(strContent.length>intLen){
strTemp =strContent.substr(0,intLen) "< br>";
strContent=strContent.substr(intLen,strContent.length);
}
strTemp = strContent;
obj.innerHTML=strTemp;
}
Full demo code:
Pola Lab
- As an experiment, "W3C", "MIT", "World Wide Web", "HTML", "CSS", "XML" , and the weird button both have tips, and the content is saved in the title
- Statements to add functions: $("div p").children().add("# Button1").polaTip();
- This plug-in can only run on browsers that support the canvas tag
- Note: excanvas is not used .js is used to support canvas under IE because this file is too large and it would be too wasteful just to draw the prompt box
< ;div class="newStyle1">
W3C is the abbreviation of the English World Wide Web Consortium, and the Chinese meaning isCouncil or World Wide Web Consortium. W3C announced in October 1994 MIT Computer Science Laboratory was established. Created by Tim Berners-Lee, inventor of the World Wide Web. The W3C organization is a non-profit organization that develops Internet standards, such as HTML, XHTML, CSS< /abbr> , XML standards are customized by W3C. W3C members (approximately 500 members) include manufacturers of technology products and services, content providers, user groups, research laboratories, standards-setting organizations and government departments, working together to reach a consensus on the development direction of the World Wide Web.

Hot AI Tools

Undresser.AI Undress
AI-powered app for creating realistic nude photos

AI Clothes Remover
Online AI tool for removing clothes from photos.

Undress AI Tool
Undress images for free

Clothoff.io
AI clothes remover

AI Hentai Generator
Generate AI Hentai for free.

Hot Article
Hot Tools

Notepad++7.3.1
Easy-to-use and free code editor

SublimeText3 Chinese version
Chinese version, very easy to use

Zend Studio 13.0.1
Powerful PHP integrated development environment

Dreamweaver CS6
Visual web development tools

SublimeText3 Mac version
God-level code editing software (SublimeText3)
Hot Topics
 1378
1378
 52
52

 How do I create and publish my own JavaScript libraries?
Mar 18, 2025 pm 03:12 PM
How do I create and publish my own JavaScript libraries?
Mar 18, 2025 pm 03:12 PM
Article discusses creating, publishing, and maintaining JavaScript libraries, focusing on planning, development, testing, documentation, and promotion strategies.
 How do I optimize JavaScript code for performance in the browser?
Mar 18, 2025 pm 03:14 PM
How do I optimize JavaScript code for performance in the browser?
Mar 18, 2025 pm 03:14 PM
The article discusses strategies for optimizing JavaScript performance in browsers, focusing on reducing execution time and minimizing impact on page load speed.
 What should I do if I encounter garbled code printing for front-end thermal paper receipts?
Apr 04, 2025 pm 02:42 PM
What should I do if I encounter garbled code printing for front-end thermal paper receipts?
Apr 04, 2025 pm 02:42 PM
Frequently Asked Questions and Solutions for Front-end Thermal Paper Ticket Printing In Front-end Development, Ticket Printing is a common requirement. However, many developers are implementing...
 How do I debug JavaScript code effectively using browser developer tools?
Mar 18, 2025 pm 03:16 PM
How do I debug JavaScript code effectively using browser developer tools?
Mar 18, 2025 pm 03:16 PM
The article discusses effective JavaScript debugging using browser developer tools, focusing on setting breakpoints, using the console, and analyzing performance.
 Who gets paid more Python or JavaScript?
Apr 04, 2025 am 12:09 AM
Who gets paid more Python or JavaScript?
Apr 04, 2025 am 12:09 AM
There is no absolute salary for Python and JavaScript developers, depending on skills and industry needs. 1. Python may be paid more in data science and machine learning. 2. JavaScript has great demand in front-end and full-stack development, and its salary is also considerable. 3. Influencing factors include experience, geographical location, company size and specific skills.
 How do I use source maps to debug minified JavaScript code?
Mar 18, 2025 pm 03:17 PM
How do I use source maps to debug minified JavaScript code?
Mar 18, 2025 pm 03:17 PM
The article explains how to use source maps to debug minified JavaScript by mapping it back to the original code. It discusses enabling source maps, setting breakpoints, and using tools like Chrome DevTools and Webpack.
 Getting Started With Chart.js: Pie, Doughnut, and Bubble Charts
Mar 15, 2025 am 09:19 AM
Getting Started With Chart.js: Pie, Doughnut, and Bubble Charts
Mar 15, 2025 am 09:19 AM
This tutorial will explain how to create pie, ring, and bubble charts using Chart.js. Previously, we have learned four chart types of Chart.js: line chart and bar chart (tutorial 2), as well as radar chart and polar region chart (tutorial 3). Create pie and ring charts Pie charts and ring charts are ideal for showing the proportions of a whole that is divided into different parts. For example, a pie chart can be used to show the percentage of male lions, female lions and young lions in a safari, or the percentage of votes that different candidates receive in the election. Pie charts are only suitable for comparing single parameters or datasets. It should be noted that the pie chart cannot draw entities with zero value because the angle of the fan in the pie chart depends on the numerical size of the data point. This means any entity with zero proportion
 The difference in console.log output result: Why are the two calls different?
Apr 04, 2025 pm 05:12 PM
The difference in console.log output result: Why are the two calls different?
Apr 04, 2025 pm 05:12 PM
In-depth discussion of the root causes of the difference in console.log output. This article will analyze the differences in the output results of console.log function in a piece of code and explain the reasons behind it. �...
