Firebug Getting Started Guide (Firefox Browser)_javascript skills
我最近就在学习怎么使用Firebug,网上找到一篇针对初学者的教程,感觉比较有用,就翻译了出来。
作者:Estelle Weyl
原文网址:http://www.evotech.net/blog/2007/06/introduction-to-firebug/
译者:阮一峰
本文是Firebug的一个概览,并不对它的所有特性进行详尽解释。不过,本文的内容对一个新手来说,应该是足够了。
目录
一、安装Firebug
二、打开和关闭Firebug
三、Firebug窗口概览
四、随时编辑页面
五、用Firebug处理CSS
六、盒状模型
七、评估下载速度
八、DOM
九、Javascript调试
十、AJAX
十一、附注
一、安装Firebug
Firebug在Firefox浏览器中运行。另外有一个Firebug lite版本,可以通过javascript调用,包含在页面中,从而在其他非Firefox浏览器中使用。本文不涉及这个版本。
安装Firebug,请访问Firebug下载页面。点击该页面右边栏中部巨大的橙黄色按钮即可。你也可以在Mozilla的FireFox Add-ons站点下载它。安装后只要重新启动FireFox,就可以使用了。
如果你已经安装过了,那么请检查是否更新到了最新版本。打开Firefox的“Tools”菜单,选择“Add-ons”命令,然后在弹出窗口中点击左下角的“Find Updates”按钮。
二、打开和关闭Firebug
在Firebug网站上,可以找到它的快捷键设置。我最常使用以下三种方法:
* 打开Firebug:按F12,或者点击浏览器状态栏右边的 绿色标志。
绿色标志。
* 关闭Firebug:按F12,或者点击浏览器状态栏右边的
 绿色标志,或者点击Firebug窗口右上角的
 红色关闭标志。
* 在单独窗口中打开Firebug:点击firebug窗口右上角的 红色箭头标识,或者使用Ctrl+F12/⌘+F12按钮。
Firebug的相关设置:
* 固定Firebug在新窗口打开:先打开firebug,点击左上角的bug标志,选择options菜单中的“Always Open in New Window”设置。
* 增加/缩小字体大小:先打开firebug,点击左上角的bug标志,选择“Text Size”命令。每次字体变化的幅度非常小,你可能需要使用多次。
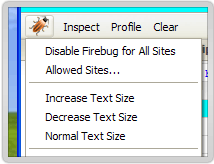
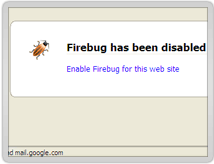
* 限制只对某些站点使用Firebug:先右击浏览器状态上的green check mark标志,选择“disable Firebug”命令。然后,再右击这个已经变灰的标志,选择“Allowed Sites...”命令,增加允许Firebug生效的域名。
三、Firebug窗口概览
* Console标签: 主要使用javascript命令行操作,显示javascript错误信息,在底部的>>>提示符后,你可以自己键入javascript命令。
* HTML标签: 显示HTML源码,并且像DOM等级结构那样,每行之前有缩进。你可以选择显示或不显示某个子节点。
* CSS标签:浏览所有已经装入的样式表,可以当场对其修改。在Firebug窗口上部,“edit”命令的旁边,有一个本页面中所有样式表的下拉列表,你可以选择一个样式表进行浏览。
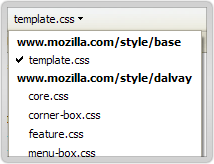
* Script标签: 显示javascript文件及其所在页面。在Firebug窗口上部,“inspect”命令的旁边,有一个本页面中所有Javascript文件的下拉列表,你可以选择一个进行浏览。你可以在javascript命令中,设置断点(breakpoint)及其出现的条件。
* DOM标签: 显示所有的页面对象和window物体的属性。因为在javascript中,所有变量都是window物体的属性,所以Firebug会显示所有变量和它们的值。
* Net标签:显示本页面涉及的所有下载,以及它们各自花费的时间,各自的HTTP请求头信息和服务器响应的头信息。XHR标签对AJAX调试很有用。
四、随时编辑页面
在HTML标签中,点击窗口上方的“inspect”命令,然后再选择页面中的文本节点,你可以对其进行修改,修改结果会马上反应在页面中。
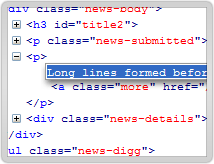
Firebug同时是源码浏览器和编辑器。所有HTML、CSS和Javascript文件中的对象,都可以用单击或双击进行编辑。当你输入完毕,浏览器中的页面立刻会发生相应变化,你可以得到瞬时反馈。DOM浏览器允许你对文档结构进行彻底的编辑,不局限于文本节点。在HTML标签中,点击窗口上部“inspect”命令旁边的“edit”命令,下方的窗口就会立刻变成一个黑白的文本编辑窗口,你可以对HTML源代码进行任意编辑。在CSS标签中,Firebug会自动补全你的输入。在DOM标签中,当你按Tab键时,Firebug会自动补全属性名。
五、用Firebug处理CSS
在DOM标签中,每个HTML元素的style属性揭示了该元素的所有CSS设置。你可以双击对这些设置进行编辑。
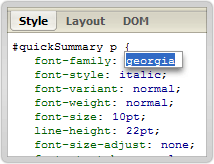
对于那些Firefox不支持的CSS规则,Firebug会自动隐藏。比如,Firebug会隐藏针对某些浏览器的CSS特定设置,以及一些它不支持的CSS3规则。所以,它会隐藏_height:25px;(下划线是一个针对IE6的设置)和p:first-of-type {color: #ff0000;} (:first-of-type是一个CSS3规定的伪类,目前只有Safari 3支持)。但是,这也意味着,如果你恰巧发生了打字错误,导致某些规则无法显示,那么你只有使用其他编辑器显示全部CSS内容,找到你的错误。
Firebug允许你关闭CSS中的某些语句,页面会立刻反映相应变化,你可以立刻查看效果。“关闭”一条语句的方法是,在该语句的左边点击,会出现一个红色的 禁止标志。该语句就会变灰。再次点击,该语句就会恢复。
Firebug允许你编辑CSS的属性和属性值。你只要对它们点击,就能编辑。修改后的效果会立刻在浏览器窗口中显示出来。这个特性最好的运用,是在确定准确定位的padding和margin时,firebug允许你用方向键逐单位的增加。
Firebug允许你增加新的属性和属性值。增加方法是双击现有的selector,然后就会出现一个空白的属性名输入框,完成输入后则会出现一个空白的属性值。
六、盒状模型
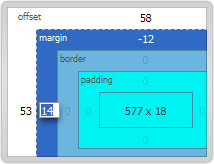
当你在HTML标签中,点击一个元素时,左面窗口显示HTML代码,右面窗口显示该元素的CSS。在CSS窗口上方,有一个layout按钮,点击后会展示与该元素相关的方块模型,包括padding、margin和border的值。要查看每一个元素的这三项值,只需点击“inspect”按钮,然后用鼠标悬停在页面中该元素的上方。
七、评估下载速度
Net标签中图形化了页面中所有http请求所用的时间。使用这个功能,必须打开Network monitoring,默认设置就是打开,但是你可以在“options”下拉菜单中关闭这个选项。你可以用这项功能评估javascript文件下载,占用整个页面显示的时间。
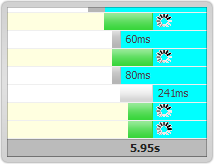
在每个HTTP请求的左面点击,会显示该次请求的头信息。
在1.0.5版以后,你可以单独查看HTML文件、CSS文件、图像文件等各自下载的时间。
八、DOM
DOM标签提供页面上所有物体的所有属性的信息。Firebug最酷的功能之一是,它可以动态修改页面,反映在浏览器窗口,但是如果使用浏览器自带的查看源码功能,你会发现源码并没有改变。
九、Javascript调试
JavaScript profiler can report the time it takes for your Javascript functions to execute, so you can see the impact of different functions on speed. The way to use this function is to open the console tab and click the Profile button above (the upper button sequence is "Inspect | Clear | Profile"). Firebug lists all functions called, and how long they took. You can add console.profile([title]) in front of a function to be tested and console.profileEnd() in the end.
The bottom of the console tag is the command line input, which starts with ">>>". If there is a result of the command line input, it will be displayed in the upper window. There is a detailed command line input API worth looking at. Firebug's built-in console object has several useful methods for calling, including console.debug, console.info, console.warning, console.error, etc. If these methods produce output, Firebug will provide a link to view the corresponding code.
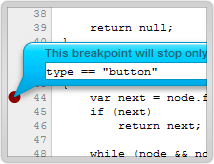
Another way to debug is to set breakpoints. The Script tag allows you to pause execution at any line. Clicking on the line number will set a breakpoint. By right-clicking on the line number, you can set a condition for a breakpoint to occur. Only when the condition is true, the program will pause execution. There is also a watch window on the right, where you can view the value of the current variable.
10. AJAX
As mentioned earlier, Firebug can capture the dynamic content of the page and other DOM changes. If you open this sample file, click the link on the page, and view the source code in the browser, you will find that nothing has changed and the source code still contains the link. However, if you view the source code in Firebug, you will find that the DOM has changed and "Hello World" has been included. This is one of the core features of Firebug. Without it, AJAX requests and responses would be invisible. With it, you can see sent and received texts, already corresponding header information. In the Net tab, you can also monitor how long each request/response takes.
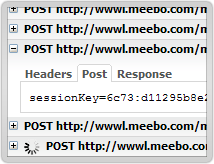
The XHR function in the Net tag is particularly useful for viewing AJAX operations. If you click on the plus sign before each server-side response, you will see the headers and content of the server-side response.
When a request is made to the server through the XMLHttpRequest object, Firebug will record the POST or GET content of the request, as well as the response header information and content. You can see these contents using the XHR function in the Net tag. It will list all server responses and how long they took. Click on the previous number. If it is a GET request, three labels will be displayed; if it is a POST request, 4 labels will be displayed:
Params: Display the name/value pairs contained in the request URL.
Headers: Display request and response header information.
Response: Displays the actual information received from the server.
Post: Displays the information sent to the server through POST request. (This GET request is not included.)
These four tags are useful for writing and debugging programs. Check the POST and Params tags to make sure your request was sent correctly. Check the Response tag to see the returned format and determine how the corresponding Javascript processing function should be written.
11. Notes
* Firebug 1.05 and previous versions are not compatible with Firefox 3.0.
* Joe Hewitt, the author of Firebug, provides this software for free. To show our love for him, you may consider making a donation to him.
* For some advanced applications of Firebug, please watch this demonstration video by Joe Hewitt (http://video.yahoo.com/watch/111597).
(End)

Hot AI Tools

Undresser.AI Undress
AI-powered app for creating realistic nude photos

AI Clothes Remover
Online AI tool for removing clothes from photos.

Undress AI Tool
Undress images for free

Clothoff.io
AI clothes remover

AI Hentai Generator
Generate AI Hentai for free.

Hot Article

Hot Tools

Notepad++7.3.1
Easy-to-use and free code editor

SublimeText3 Chinese version
Chinese version, very easy to use

Zend Studio 13.0.1
Powerful PHP integrated development environment

Dreamweaver CS6
Visual web development tools

SublimeText3 Mac version
God-level code editing software (SublimeText3)

Hot Topics
 1359
1359
 52
52
 Getting Started with PHP: PATCH Requests and Responses
May 23, 2023 pm 04:21 PM
As the Internet continues to develop, the demand for front-end and back-end technologies is also increasing. As a back-end developer, mastering PHP is essential. In PHP development, we often need to process requests and responses. This article will discuss the PATCH request and response, providing a practical guide for PHP beginners. 1. PATCH request The PATCH request is an HTTP request method, which is used to update existing resources. In the HTTP protocol, there is a way to use a PUT request to
 A Beginner's Guide to Natural Language Processing in PHP
Jun 11, 2023 pm 06:30 PM
With the development of artificial intelligence technology, Natural Language Processing (NLP) has become a very important technology. NLP can help us better understand and analyze human language to achieve some automated tasks, such as intelligent customer service, sentiment analysis, machine translation, etc. In this article, we will cover the basics and tools for natural language processing using PHP. What is natural language processing? Natural language processing is a method that uses artificial intelligence technology to process
 Beginner's Guide to Java Development: From Getting Started to Giving Up
Sep 22, 2023 am 08:25 AM
Java is a programming language widely used in software development. Its concise syntax and powerful functions make it the first choice for many developers. However, for beginners, learning Java may feel a little difficult. This article will provide a guide for Java development beginners to help them from getting started to giving up. Learn basic syntax. The basic syntax of Java includes variables, data types, operators, conditional statements, loop statements, etc. Beginners should start with these basic concepts and write simple code examples to deepen their understanding.
 PHP Beginner's Guide: Parsing Taobao Product Details API Document
Jun 30, 2023 pm 06:22 PM
Introduction to PHP Technology: Taobao Product Details API Document Interpretation Introduction: PHP, as a programming language widely used in Web development, has a large user group and a rich extension library. Among them, using PHP to develop Taobao product details API is a very practical and common requirement. This article will provide a detailed interpretation of the Taobao product details API document to provide an introductory guide for beginners. 1. What is Taobao Product Details API? Taobao Product Details API is an interface provided by Taobao open platform.
 Getting Started with PHP: PHP and YAML
May 20, 2023 pm 08:21 PM
PHP is a popular server-side scripting language commonly used for web development, while YAML is a lightweight data serialization format used for configuration files and data exchange. In this article, we'll explore how PHP works with YAML and how to get started. PHP and YAML When developing web applications, developers need to deal with a large amount of data and configuration. These data and configurations can be stored in a database or using text files. Text files usually use XML, JSON or YA
 Starting from scratch: PHP WebSocket development introductory guide and function implementation tutorial
Sep 12, 2023 am 10:51 AM
Starting from scratch: PHP WebSocket development introductory guide and function implementation tutorial 1. Introduction With the development of the Internet, the demand for real-time communication is increasing. As a new real-time communication protocol, WebSocket has gradually attracted the attention and use of developers. This article will use PHP as the development language to introduce the basic concepts of WebSocket, and provide an introductory development guide suitable for beginners to help readers implement WebSocket functions from scratch. 2. WebSocket
 Getting Started with PHP: Code Refactoring
May 26, 2023 pm 04:21 PM
Refactoring is a very important process when writing PHP code. As an application grows, the code base becomes larger and harder to read and maintain. Refactoring is to solve this problem and make the code more modular and better organized and extensible. When we refactor the code, we need to consider the following aspects: Code style Code style is a very important point. Keeping your coding style consistent will make your code easier to read and maintain. Please follow PHP coding standards and be consistent. Try using a code style checking tool such as PHP
 Beginner's Guide to PHP Image Processing
Jun 11, 2023 am 08:49 AM
PHP is a very popular server-side programming language and it is widely used for web development. In web development, image processing is a very common requirement, and it is also very simple to implement image processing in PHP. This article will briefly introduce the introductory guide to PHP image processing. 1. Environmental requirements To use PHP image processing, you first need the support of the PHPGD library. The library provides functionality for writing images to files or outputting them to a browser, cropping and scaling images, adding text, and making images grayscale or inverting. therefore


