
 Web Front-end
JS Tutorial
JavaScript error handling and debugging experience summary_javascript skills
Web Front-end
JS Tutorial
JavaScript error handling and debugging experience summary_javascript skills
JavaScript error handling and debugging experience summary_javascript skills

Here is a summary of JS error handling and debugging methods
Method 1: Use alert() and document.write() methods to monitor variable values.
alert() will stop the code from continuing to run while the dialog box pops up to display the variable value until the user clicks the "OK" button, while document.write() continues to run the code after outputting the value. When debugging JS, you can choose this method according to the specific situation.
For example, the following code: Add the data starting with 1 in array a to array b
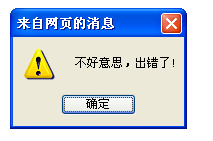
When the
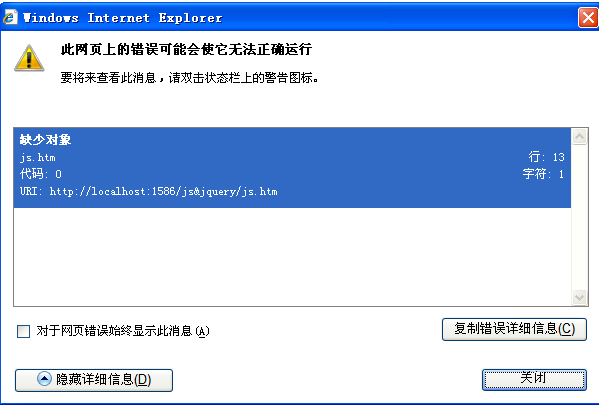
code runs the onload event marked by body, it calls a non-existent function NonExist(), which is generated by An error occurred, as shown below:
At the same time, the code debugging error of the browser itself also appeared:
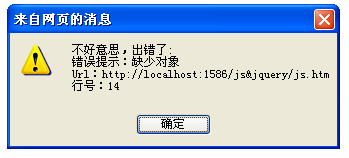
It is very simple to avoid the browser's own error message. You only need to handle the onerror event and finally return ture. The code is as follows:
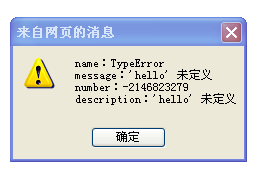
But this approach does not solve the error Any help. In fact, onerror also provides 3 parameters to determine the nature of the error. Code:
< ;body onload="NonExist()" >
is running in IE:
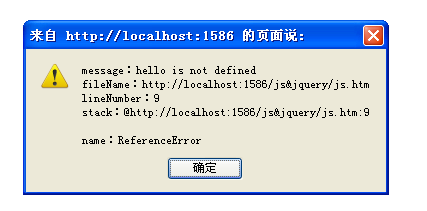
Prompt for running in Firefox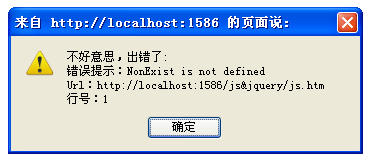
When an error event occurs in the IE browser, the normal code will continue When executed, all variables and data are saved and can be accessed through the onerror event handler. In Firefox, normal code execution will end, and all variables and data before the error occurs will be destroyed.
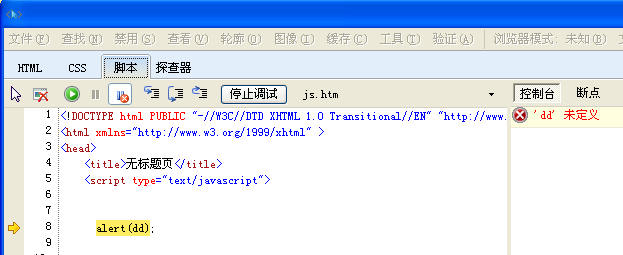
Method 3: Use try….catch statement to find the error
IERuntime prompt:
Firefox Tips when running:
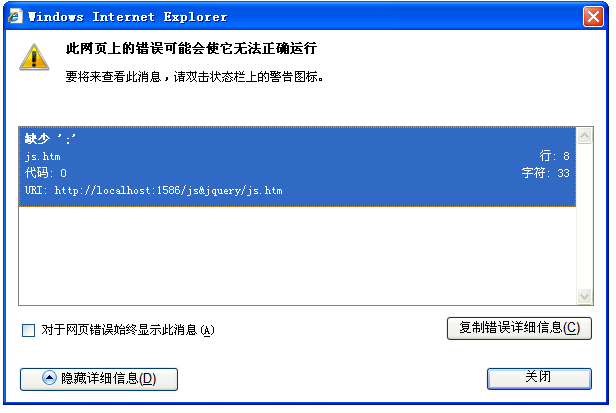
It can be easily done by try…..catch Found the wrong question, but unfortunately this statement does not handle statement errors well. For example:
try语句里面出现了括号不匹配的错误,而整个代码并没有运行catch中的模块,而是浏览器弹出了错误提示框,如下图:
方法4:使用Firefox错误控制台调试:
在Firefox菜单栏中选择“工具”->“错误控制台”,便可以打开它,所有浏览中运行的错误,警告,消息都会传错误控制台,如下:
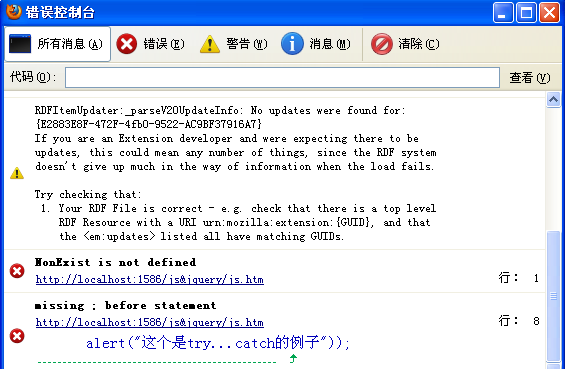
Firefox提示的错误信息要比IE全面而且准确的多。
方法5:使用Firefox插件FireBug
Firebug是Firefox下的一款开发类插件,现属于Firefox的五星级强力推荐插件之一。它集HTML查看和编辑、Javascript控制台、网络状况监视器于一体,是开发JavaScript、CSS、HTML和Ajax的得力助手。Firebug如同一把精巧的瑞士军刀,从各个不同的角度剖析Web页面内部的细节层面,给Web开发者带来很大的便利。具体如何安装使用FireBug可参考这篇文章:http://apps.hi.baidu.com/share/detail/15314208
方法6:使用Miscrosoft Script Debugger调试:
在IE菜单栏中打开“工具”->“Internet选项“,选择”高级“,将”禁用脚本调试“复选框的勾去掉。
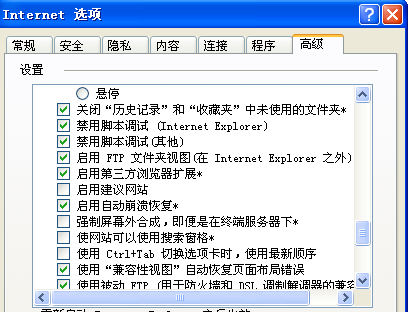
具体如何使用就不介绍了。
方法7:使用IE下的JS调试工具companion.js
一款像firefox中的firedebug工具类似的一个工具包,它的特点就是可以有好的提示错误,并且可以在IE浏览器下方出现控制台输出.方便及时调试。
具体可参考这篇文章:http://hi.baidu.com/argv/blog/item/f4efe67ac370f7e12f73b3ad.html
There are other JS debugging tools, so I won’t introduce them one by one. You can also introduce some better JS error handling methods or JS Debugging tools.

Hot AI Tools

Undresser.AI Undress
AI-powered app for creating realistic nude photos

AI Clothes Remover
Online AI tool for removing clothes from photos.

Undress AI Tool
Undress images for free

Clothoff.io
AI clothes remover

AI Hentai Generator
Generate AI Hentai for free.

Hot Article
Hot Tools

Notepad++7.3.1
Easy-to-use and free code editor

SublimeText3 Chinese version
Chinese version, very easy to use

Zend Studio 13.0.1
Powerful PHP integrated development environment

Dreamweaver CS6
Visual web development tools

SublimeText3 Mac version
God-level code editing software (SublimeText3)
Hot Topics


 How to use LeakSanitizer to debug C++ memory leaks?
Jun 02, 2024 pm 09:46 PM
How to use LeakSanitizer to debug C++ memory leaks?
Jun 02, 2024 pm 09:46 PM
How to use LeakSanitizer to debug C++ memory leaks? Install LeakSanitizer. Enable LeakSanitizer via compile flag. Run the application and analyze the LeakSanitizer report. Identify memory allocation types and allocation locations. Fix memory leaks and ensure all dynamically allocated memory is released.
 How to effectively handle error scenarios in C++ through exception handling?
Jun 02, 2024 pm 12:38 PM
How to effectively handle error scenarios in C++ through exception handling?
Jun 02, 2024 pm 12:38 PM
In C++, exception handling handles errors gracefully through try-catch blocks. Common exception types include runtime errors, logic errors, and out-of-bounds errors. Take file opening error handling as an example. When the program fails to open a file, it will throw an exception and print the error message and return the error code through the catch block, thereby handling the error without terminating the program. Exception handling provides advantages such as centralization of error handling, error propagation, and code robustness.
 Shortcut to golang function debugging and analysis
May 06, 2024 pm 10:42 PM
Shortcut to golang function debugging and analysis
May 06, 2024 pm 10:42 PM
This article introduces shortcuts for Go function debugging and analysis, including: built-in debugger dlv, which is used to pause execution, check variables, and set breakpoints. Logging, use the log package to record messages and view them during debugging. The performance analysis tool pprof generates call graphs and analyzes performance, and uses gotoolpprof to analyze data. Practical case: Analyze memory leaks through pprof and generate a call graph to display the functions that cause leaks.
 How to perform error handling and logging in C++ class design?
Jun 02, 2024 am 09:45 AM
How to perform error handling and logging in C++ class design?
Jun 02, 2024 am 09:45 AM
Error handling and logging in C++ class design include: Exception handling: catching and handling exceptions, using custom exception classes to provide specific error information. Error code: Use an integer or enumeration to represent the error condition and return it in the return value. Assertion: Verify pre- and post-conditions, and throw an exception if they are not met. C++ library logging: basic logging using std::cerr and std::clog. External logging libraries: Integrate third-party libraries for advanced features such as level filtering and log file rotation. Custom log class: Create your own log class, abstract the underlying mechanism, and provide a common interface to record different levels of information.
 How to conduct concurrency testing and debugging in Java concurrent programming?
May 09, 2024 am 09:33 AM
How to conduct concurrency testing and debugging in Java concurrent programming?
May 09, 2024 am 09:33 AM
Concurrency testing and debugging Concurrency testing and debugging in Java concurrent programming are crucial and the following techniques are available: Concurrency testing: Unit testing: Isolate and test a single concurrent task. Integration testing: testing the interaction between multiple concurrent tasks. Load testing: Evaluate an application's performance and scalability under heavy load. Concurrency Debugging: Breakpoints: Pause thread execution and inspect variables or execute code. Logging: Record thread events and status. Stack trace: Identify the source of the exception. Visualization tools: Monitor thread activity and resource usage.
 Best tools and libraries for PHP error handling?
May 09, 2024 pm 09:51 PM
Best tools and libraries for PHP error handling?
May 09, 2024 pm 09:51 PM
The best error handling tools and libraries in PHP include: Built-in methods: set_error_handler() and error_get_last() Third-party toolkits: Whoops (debugging and error formatting) Third-party services: Sentry (error reporting and monitoring) Third-party libraries: PHP-error-handler (custom error logging and stack traces) and Monolog (error logging handler)
 PHP Debugging Errors: A Guide to Common Mistakes
Jun 05, 2024 pm 03:18 PM
PHP Debugging Errors: A Guide to Common Mistakes
Jun 05, 2024 pm 03:18 PM
Common PHP debugging errors include: Syntax errors: Check the code syntax to make sure there are no errors. Undefined variable: Before using a variable, make sure it is initialized and assigned a value. Missing semicolons: Add semicolons to all code blocks. Function is undefined: Check that the function name is spelled correctly and make sure the correct file or PHP extension is loaded.
 Internationalization in golang function error handling
May 05, 2024 am 09:24 AM
Internationalization in golang function error handling
May 05, 2024 am 09:24 AM
GoLang functions can perform error internationalization through the Wrapf and Errorf functions in the errors package, thereby creating localized error messages and appending them to other errors to form higher-level errors. By using the Wrapf function, you can internationalize low-level errors and append custom messages, such as "Error opening file %s".
