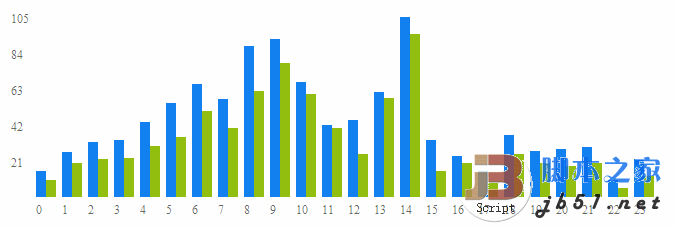
For work needs, use JavaScript to make a statistical chart:
After completion, make a note and share it with everyone to learn from each other. There are still some problems and it is not perfect yet.
It refers to Baidu Space, Central Management Center, Access Statistics, and js statistical charts. However, there are still differences in application, because in the project I am working on, new statistical tables need to be drawn in real time. When the data changes, the method of drawing the table will be called. So we need to consider the issue of page performance.
The following is the preview after completion. You can see that it takes 0.005 milliseconds to draw a table, which is 1/200th of a second. I am quite satisfied with the efficiency!
Currently, it works normally in firefox, chrome, and IE8, but there is a problem in IE6. I don’t care about IE6 now. The front-end brothers should try their best to guide users to give up IE6. 
All codes are as follows: you can copy and run them directly.
Now there is a problem. The solution is that in the firebug debugging state, once the mouse moves to the horizontal ruler line, an error will be reported!
If anyone knows how to solve this problem, please feel free to enlighten me! Thanks!


